Figures & data
Figure 1. Black and white stitched BSE images (left) of the whole coupon within the red area, clinoptilolite (black) coverage of the steel (white) was quantified using imageJ to give the percentage (below the image). EDX maps (right) from 4 randomly allocated spots on the coupons, grouped the clinoptilolite (green) and steel (pink) phases separately for quantification of clinoptilolite coverage by % surface area (below image).
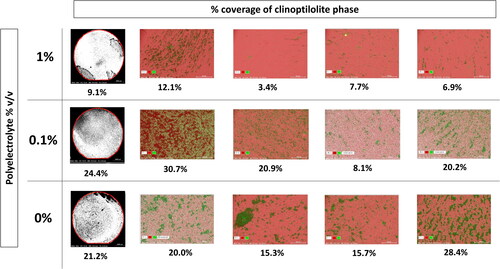
Table 1. Percentages of clinoptilolite attached to stainless steel coupons based on 4 random areas (1-4) and the whole coupon, in solutions of different concentrations of polyelectrolyte in deionised water. Percentages determined via EDX mapping of the phases and ImageJ processing of black and white SEM BSE images of the whole coupon.
Figure 2. Epifluorescence microscopy micrographs of one biofilm coupon with LIVE/DEADTM BacLightTM staining, with living bacteria in green and dead bacteria in red. The coupon was extracted after 3 days, after inoculation and biofilm maturation and prior to exposure to clinoptilolite fines or metals in solution.
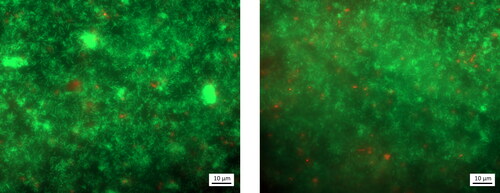
Figure 3. Images of coupons removed from the biofilm (a) and non-biofilm MRD (b) after exposure to clinoptilolite fines (without exposure to any metal solutions), and corresponding SEM BSE images of a biofilm (c) and non-biofilm coupon (d), on which steel is seen as the lighter grey and clinoptilolite as the darker grey.
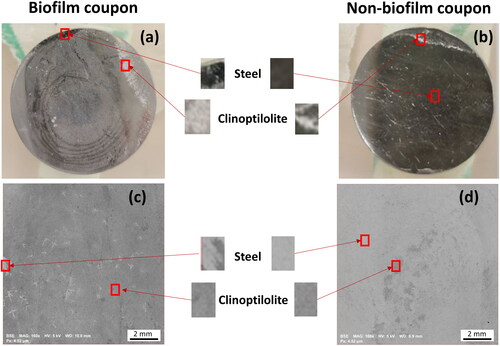
Figure 4. SEM image (a) and EDX maps (b-d) of the biofilm-coated coupon with clinoptilolite fines, prior to exposure to metals. Cells indicated by the organic carbon (b), clinoptilolite by the silicon (c), and steel by the iron (d).
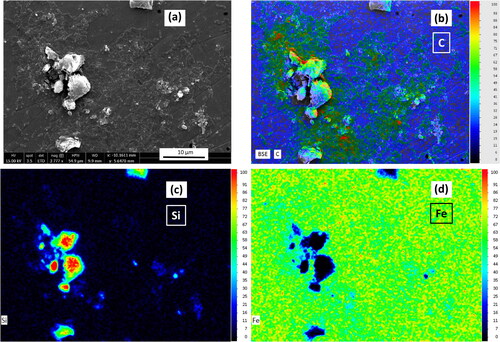
Figure 5. Concentration (µM) from ICP-MS of solutions containing Cs (a), Sr (b), Ru (c), Co (d), and Eu (e) in the biofilm and non-biofilm circulating MRD systems over a period of 8 days.
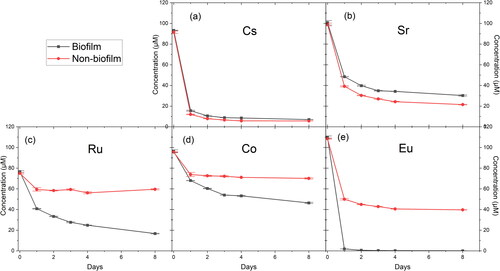
Figure 6. LA-ICP-MS elemental maps (80 x 40 µm) of Co, Cs, Eu, Ru, Sr, Al and Si on the surface of the biofilm and non-biofilm coupons. The intensities are normalised to the Cr detected as it was consistent across the biofilm and non-biofilm systems.
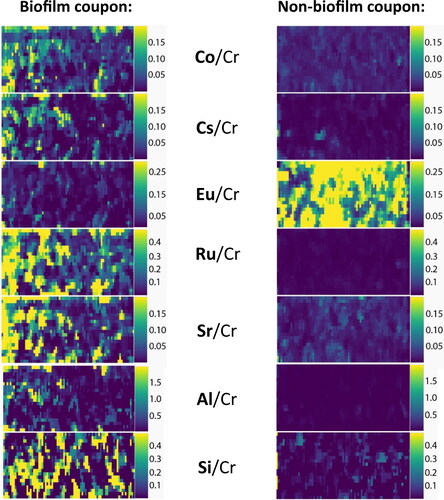
Table 2. Average qualitative concentrations (μg.g−1) of elements detected on the surface of the biofilm and non-biofilm MRD system coupons via LA-ICP-MS (15 spots averaged per sample, with standard deviations shown, all data to 3 significant figures).
Figure 7. Co 2p3/2 XPS region for the biofilm (a) and non-biofilm (b) coupons, and Ru 3p3/2 XPS region for the biofilm (c) and non-biofilm (d) coupons.
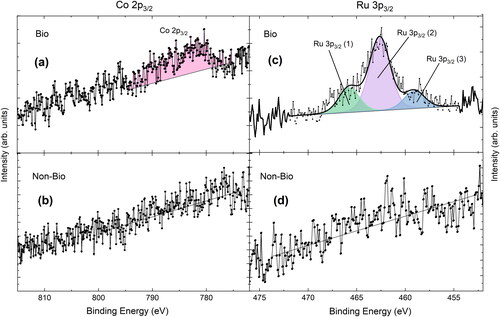
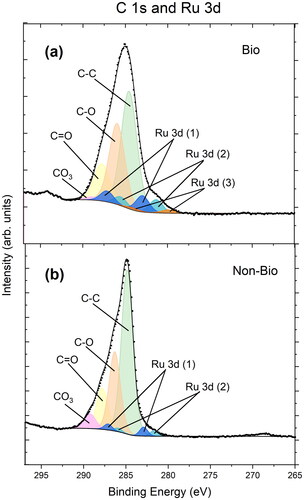
Figure 8. XPS region encompassing C 1s and Ru 3d for the biofilm (a) and non-biofilm (b) coupons.