Figures & data
Figure 1. (Colour online) In a master-detail interface, changes in the primary view controller (the master project-view) drive changes in a secondary view controller (the detail views: render-, detail-, python- and log-views).
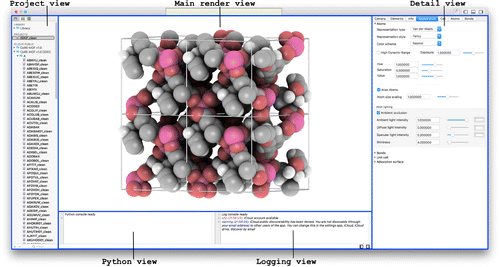
Table 1. Basic mouse and keyboard event definitions for interactive use.
Figure 2. (Colour online) Editing structures and atomic selection using (i) the render-view or (ii) via the data-view, i.e. the atom-positions in tabular form.
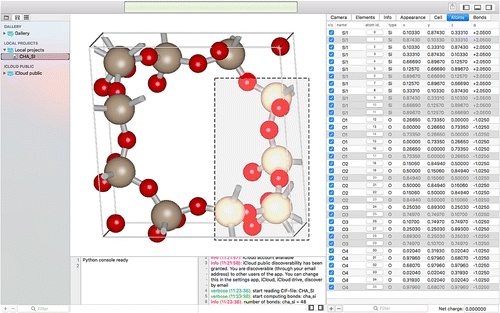
Figure 3. (Colour online) The atomic positions of two unit cells of the CHA-type zeolite, and the energy surface at three different values. CHA has (for helium) small inaccessible pockets located at (0,0,0).
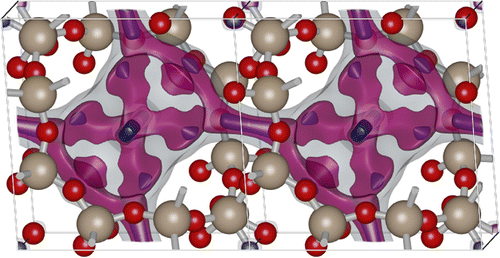
Figure 4. (Colour online) Ambient occlusion is computed per scene, (left) the water, cations and anions in the ionic liquid do not see each other, (right) the cations and anions occlude each other. The water is treated separately and drawn in ball-and-stick style.

Figure 5. (Colour online) A super-cell of unit cells of MIL-101; each MIL-101 (89 Å
89 Å
89 Å) contains 14416 atoms. The ambient occlusion has to be computed based on the super-cell because the outside cells receive more light than the interior cells.
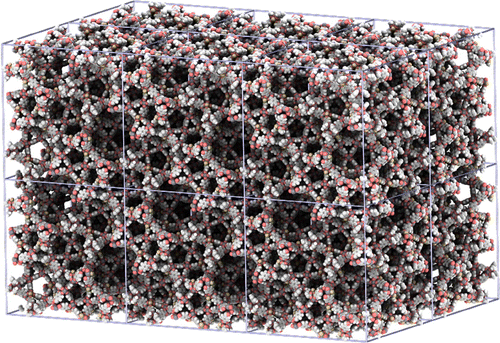
Figure 6. (Colour online) Three structures, IRMOF-1, IRMOF-10, and IRMOF-16, placed at different positions relative to eachother. The unit cells increase in size as 25.832 Å, 34.2807 Å, and 42.9806 Å, respectively.
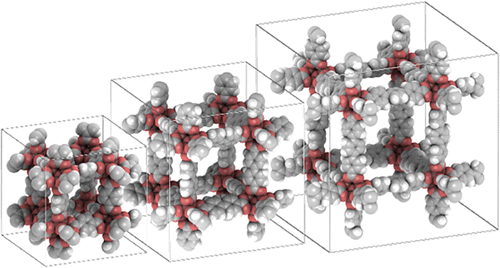
Figure 7. (Colour online) Example of a radial gradient as background. Alternatively, you can use a solid color, a linear gradient or a picture from file as background.
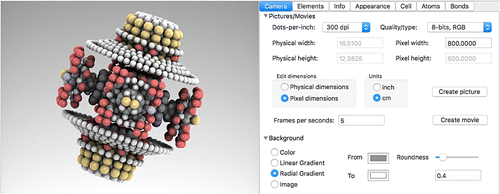
Figure 8. (Colour online) Screening the CoRE MOF and IZA database. All structures in the subtree under the selected directory in the left (project) pane can be queried (for ‘iCloud Public’ approximately 8000 structures). In the right panel the predicate can be edited, the results of the search are shown real-time in the central panel. Here, six structures satisfy the query for structure with a helium void fraction 0.9, geometric nitrogen surface area
5000 m
/g, and restricting pore diameter
10.0 Å.
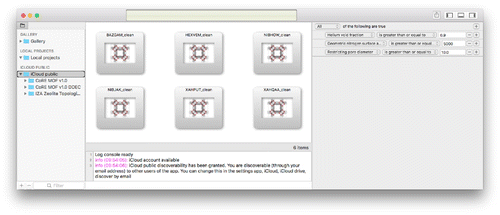
Figure 9. (Colour online) The HEXVEM structure (a) from the CoRE MOF database, (b) the conventional cell with spacegroup -F 2 2 3 (spacegroup number 203). The primitive is four times smaller in volume than the conventional cell.
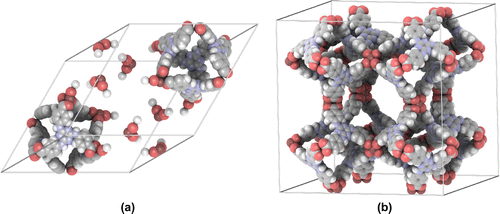
Figure 10. (Colour online) Atoms, bonds, cell boundaries: (a) zoom in showing the (near-)pixel-perfect, anti-aliased, HDR rendering of atoms and bonds, (b) the cut of bonds that cross the unitcell boundary.
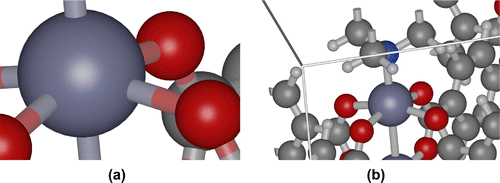
Figure 11. (Colour online) Pore-volume of MFI-type zeolite: (a) MFI structure with pore adsorption surface, (b) probability density P(d) as a function of the probe-diameter d for MFI with positions taken from IZA; the derivative of this function is the Pore Size Distribution (PSD). The framework model is taken from TraPPE-zeo [Citation59], and we have used and the minimum of the LJ-potential
as the upper- and lower-boundary, respectively, of the size of an atom and plot the area in between these as a range of reasonable values. The value computed using the helium void fraction is 0.265 with
of helium as 2.64 Å and this value is consistent with the probability density P(d) at this probe diameter. Computed properties are, density 1838.0 kg/m
, helium void fraction 0.265, gravimetric surface area 657 m
/g, 1209 m
/cm
, specific volume 0.544 cm
/g, accessible pore volume 0.144 cm
/g.
![Figure 11. (Colour online) Pore-volume of MFI-type zeolite: (a) MFI structure with pore adsorption surface, (b) probability density P(d) as a function of the probe-diameter d for MFI with positions taken from IZA; the derivative of this function is the Pore Size Distribution (PSD). The framework model is taken from TraPPE-zeo [Citation59], and we have used and the minimum of the LJ-potential as the upper- and lower-boundary, respectively, of the size of an atom and plot the area in between these as a range of reasonable values. The value computed using the helium void fraction is 0.265 with of helium as 2.64 Å and this value is consistent with the probability density P(d) at this probe diameter. Computed properties are, density 1838.0 kg/m, helium void fraction 0.265, gravimetric surface area 657 m/g, 1209 m/cm, specific volume 0.544 cm/g, accessible pore volume 0.144 cm/g.](/cms/asset/245973be-0a25-480b-92ce-0ff9431069a3/gmos_a_1426855_f0011_oc.gif)
Figure 12. CoRE-MOF and IZA structure property relationships, (left) gravimetric surface area, and (right) volumetric surface area, as a function of helium void fraction.
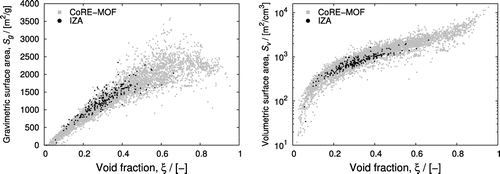
Figure 13. (Colour online) Screening performance of the iRASPA command-line utility, (left) time for a single evaluation of the surface area, (right) time for a single evaluation of the helium void fraction, both as a function of the number of atoms in the unit cell. Smaller values are better.
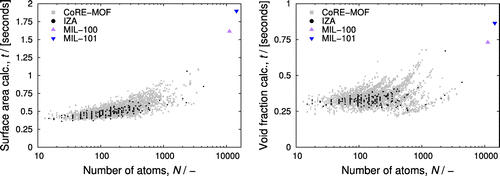
Figure 14. (Colour online) Cu-BTC with helium energy iso-contour levels: 0 (grey, opacity 0.1), -300 K (plum purple, opacity 0.3), and -410 K (spring green, opacity 1.0): (left) front-view, (right) side-view.
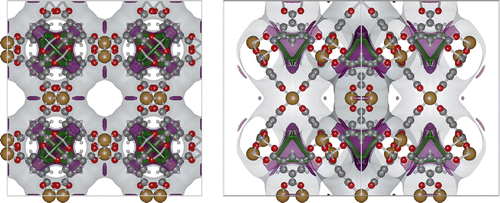
Figure 15. (Colour online) Visualisation of an aqueous solution of ionic liquids: (a) full system, (b) [Tf2N] anion, (c) [C4MIM]
cation, (d) water solvent. The computed helium void fraction are 0.141, 0.162 and 0.685, respectively, for the anion, cation and water solvent. The individual contributions add up to 0.988, which is close to unity.
![Figure 15. (Colour online) Visualisation of an aqueous solution of ionic liquids: (a) full system, (b) [Tf2N] anion, (c) [C4MIM] cation, (d) water solvent. The computed helium void fraction are 0.141, 0.162 and 0.685, respectively, for the anion, cation and water solvent. The individual contributions add up to 0.988, which is close to unity.](/cms/asset/0cefff89-dd5c-4d43-85e9-33452ff17aa0/gmos_a_1426855_f0015_oc.gif)
Figure 16. (Colour online) Structure of the liquid at the same geometric void fraction : (left) CO
at 230K and (right) methanol at 350K. The chemical potential of CO
is -15.9 kJ/mol, and -30.6 kJ/mol for methanol.
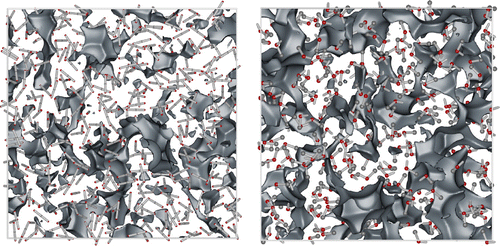
Figure 17. (Colour online) Visualising adsorption: BTEX mixture at 433K in the CoBDP MOF, (top) side view of the channel, (left) front view, (right) front view with adsorbates in stick-style. CoBDP is a rectangular copper-MOF based on a 1,4-benzenedipyrazolate linker: unit cells; unit cell
,
,
,
.
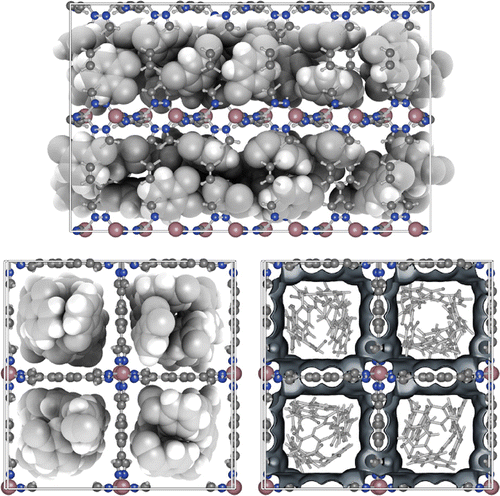
Figure 18. (Colour online) Visualising diffusion path-ways: The path of a single CO molecule inside the pores of the IRMOF-1 nanoporous material. The adsorption surface has been drawn with a transparent blue colour. (integration step 0.5 fs, snapshot taken every 200 steps, temperature 298 K).
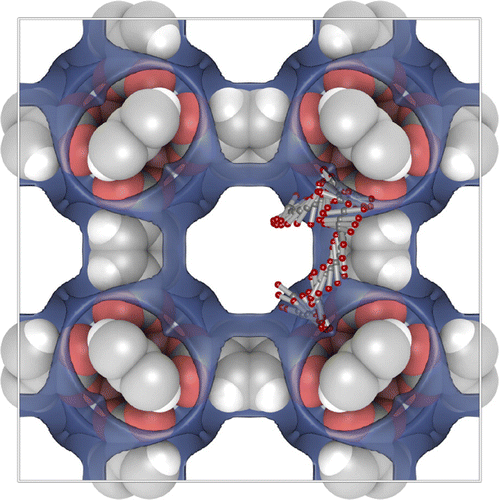
Figure A1. The rendering pipeline is a computer graphics model that describes the conceptual rendering steps of a 3D graphics system from the input vertices to pixels on the screen.

Figure A2. Coordinate systems for graphics rendering. The natural coordinate system for the hardware is the Normalised Device Coordinates (NDC) which range from in all 3 axes. The steps before are used to simulate a virtual camera. It transform the model-space to world-space and then applies a projection matrix to get camera coordinates. Points outside the viewing frustum are clipped in clip coordinates, and using perspective divide the clip coordinates are transformed to NDC. The last step scales and translates the NDC in order to fit into the rendering screen viewport.

Figure A3. (Colour online) Drawing atoms with imposters: (a) first draw a quad that extends the size of the atom taking perspective projection into account, (b) discard all pixels that are outside a circle the size of the atom, (c) colour each pixel appropriately using the position and normal.

Figure A4. (Colour online) Illustration showing the mapping of a square texture on a sphere: (a) the folding of the texture around the texture, (d) the front of the sphere, and (g) the result of bi-linear interpolation which shows artefacts where the four corners of the texture patch meet. Tarini et al. solved the continuity problem using periodic boundary conditions on the texture [Citation17]; we now get (b), (e) and (h). Indeed, (h) is continuous, but (e) shows the overall area of the edge is now twice as large. Therefore, a second change is needed: the texture patch is shrunk in texture space by half a texel in every direction [Citation17].
![Figure A4. (Colour online) Illustration showing the mapping of a square texture on a sphere: (a) the folding of the texture around the texture, (d) the front of the sphere, and (g) the result of bi-linear interpolation which shows artefacts where the four corners of the texture patch meet. Tarini et al. solved the continuity problem using periodic boundary conditions on the texture [Citation17]; we now get (b), (e) and (h). Indeed, (h) is continuous, but (e) shows the overall area of the edge is now twice as large. Therefore, a second change is needed: the texture patch is shrunk in texture space by half a texel in every direction [Citation17].](/cms/asset/f86ad3f9-6784-4d80-81d2-14451169ad75/gmos_a_1426855_f0022_oc.gif)
Figure A5. (Colour online) Illustration of ambient occlusion of four spheres: (a) the ambient occlusion texture, (b) ambient occlusion added together with a blue ambient and white specular color, and (c) using texture bi-linear interpolation.
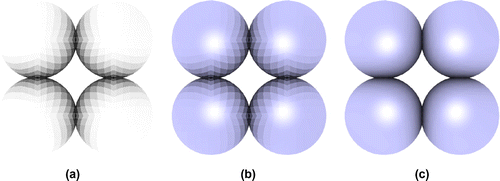
Figure A6. (Colour online) Storing ambient occlusion in a texture atlas: (a) the IRMOF-1 structure (424 atoms) shown with ambient occlusion, (b) typical depth-texture of a randomly rotated structure showing which pixels receive light (from the camera direction, (c) storage the floating point ambient occlusion in the red-component of a large global texture. Each local texture per atom is pixels, the global texture is of size
.
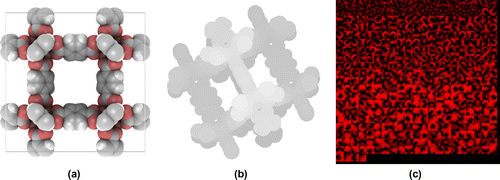
Figure A7. (Colour online) Glow effect: (a) the selected atoms drawn with a glow effect, (b) the selected atoms smeared out using Gaussian blur, (c) the original structure. Adding contribution (b) to (c) leads to figure (a) where the selected atoms appear to ‘glow’.

Table B1. Look-up table of the point-group using the number of occurrences of symmetries (,
,
,
,
, 1, 2, 3, 4, 6). |N| is the Laue group dependent rotation-part to be used in the construction of a conventional basis.
