Figures & data
Table 1. Results from atomistic adhesion simulations using the ribbon geometry.
Figure 1. (colour online) Top and side views of a lipid ribbon adsorbed on the rutile 100 surface. Water is omitted for clarity.
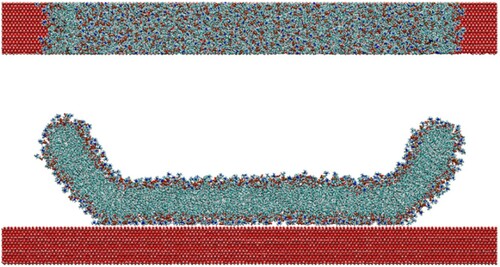
Figure 2. (colour online) Schematic of the CG DMPC lipid. Beads are shown as black circles, harmonic bonds are shown as red lines and blue arrows indicate harmonic angles.
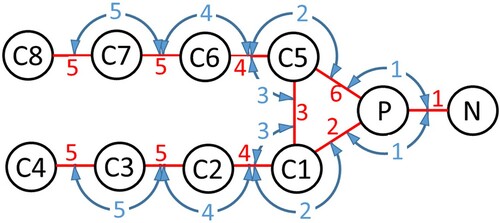
Figure 3. (colour online) Membrane tension as a function of ApL for the CG bilayer over a range of temperatures. The black line indicates the behaviour of the atomistic bilayer.
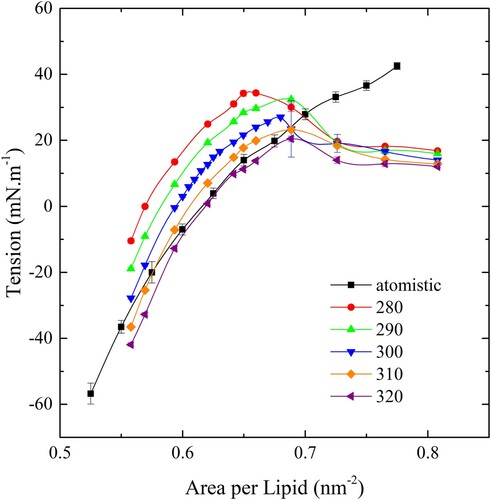
Figure 4. (colour online) An illustration of the buckled membrane, where and
are the dimensions of the simulation cell,
is the coordinate measured along the membrane, and
is the angle between the tangent to the membrane and the x-axis.
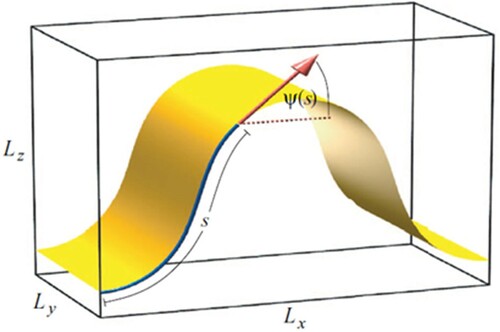
Figure 5. (colour online) Plots of restorative bending forces in the x-direction against bending strain with fits to Equation (2) shown by the dashed line.
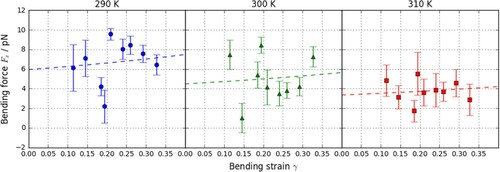
Figure 6. (colour online) PMF curves for a CG lipid interacting with an atomistic slab. The black line denoted the PMF for an atomistic lipid and a gold slab in water.
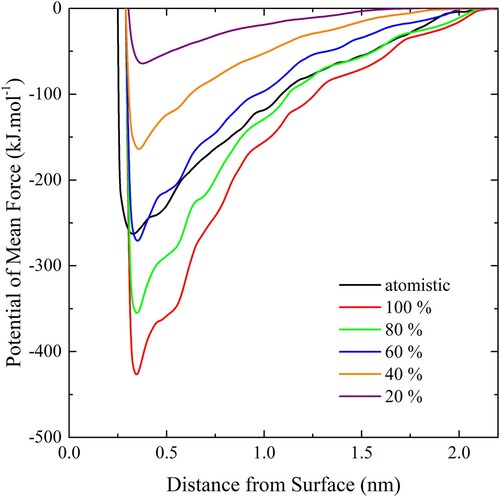
Figure 7. (colour online) The adhesion strength of CG bilayers on the slab using a range of scaling factors and temperatures.
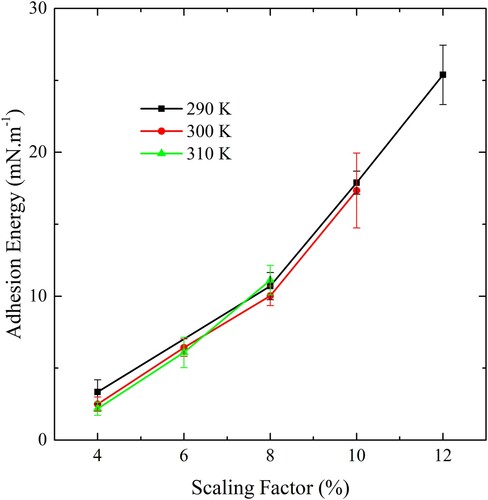
Figure 8. (colour online) Snapshot of a CG bilayer in the disk configuration. Red arrows show the force acting on the pull groups. The disk contains 2400 CG lipids and the disk is 30 nm in diameter.
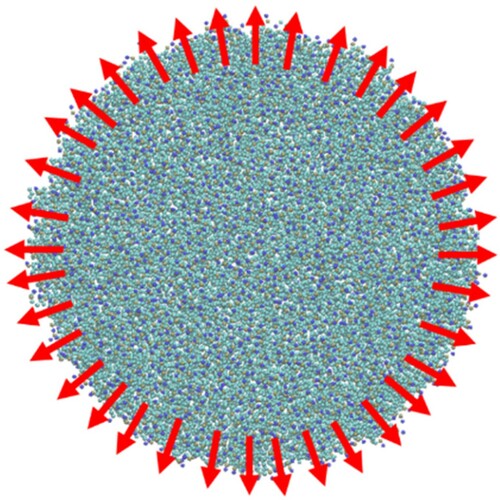
Figure 9. (colour online) The dependence of the membrane tension on ApL. The tension measured in the disk geometry is shown in red and the fit illustrated by the green line. The black symbols show the dependence generated using a fully periodic bilayer.
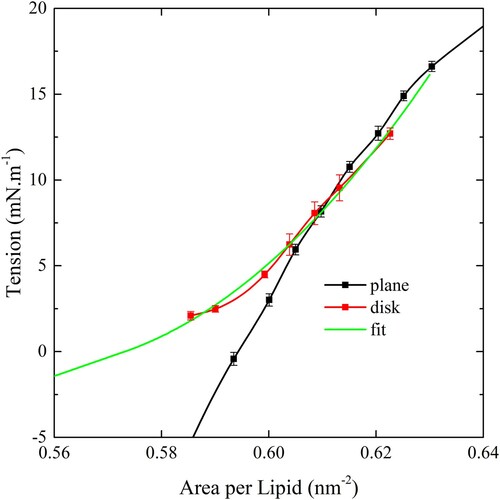
Figure 10. (colour online) Top and side views of a 10 nm particle undergoing wrapping by a CG bilayer in the disk geometry. Red arrows show the direction of restraining potentials. Note that not all the peripheral position restraints are shown in the side view.
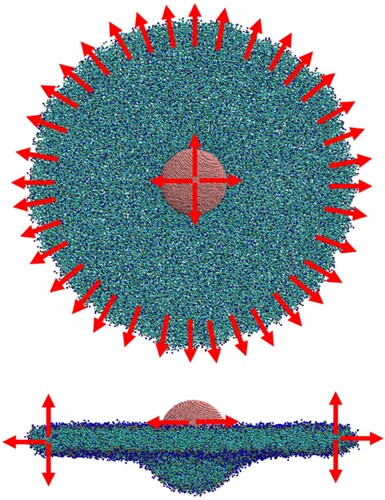
Figure 11. (colour online) Top and side views of a 10 nm cylinder undergoing wrapping by a CG bilayer in the ribbon geometry. Red arrows show the direction of restraining potentials.
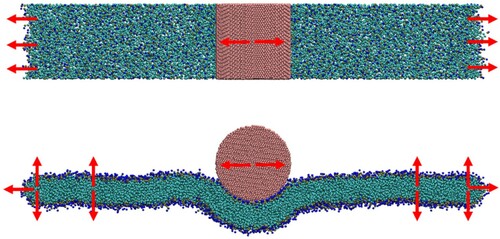
Figure 12. (colour online) Illustration of the wrapping geometry and membrane parametrization. An asymptotically flat membrane adheres partially to a spherical colloid of radius a with a degree of wrapping given by . Cylindrical symmetry around the
axis is assumed. Figure reproduced from Ref [Citation19].
![Figure 12. (colour online) Illustration of the wrapping geometry and membrane parametrization. An asymptotically flat membrane adheres partially to a spherical colloid of radius a with a degree of wrapping given by z=1−cosα. Cylindrical symmetry around the eh axis is assumed. Figure reproduced from Ref [Citation19].](/cms/asset/06a5dd53-dc1b-4c8a-9f43-961cac274459/gmos_a_1996574_f0012_ob.jpg)
Figure 13. (colour online) Snapshot showing the simulation geometry for determination of in the case of cylinder wrapping. The harmonic potentials are applied between the central axis of the cylinder and each end of the ribbon.
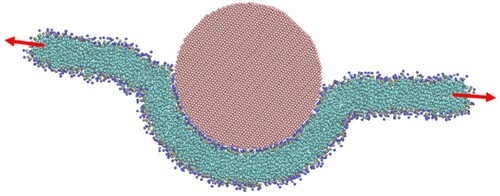
Figure 14. (colour online) Membrane tension as a function of penetration depth for wrapping of spherical particles by a CG bilayer in the disk geometry. Dashed lines show the relation between tension and penetration depth with ws given by Equation (6) and solid lines are fits with ws allowed to vary according to Equation (15). Red lines correspond to a spherical particle 15 nm in diameter, blue 10 nm and green 6 nm.
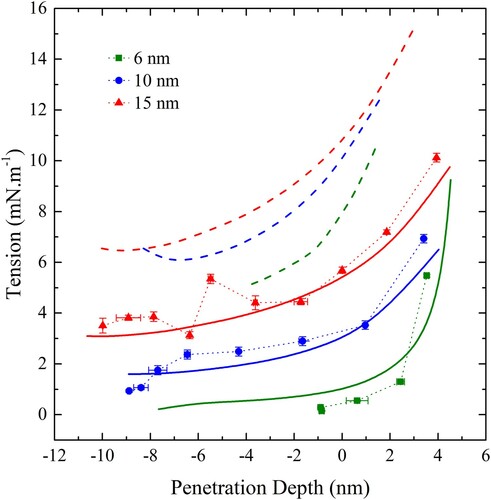
Figure 15. (colour online) The effective contact energy, , as a function of curvature. Blue points denote spheres and orange points denote cylinders. The black line is a quadratic fit to both sets of data and the green line is the prediction for an infinitesimally thin film with bending modulus equal to that of a free membrane.
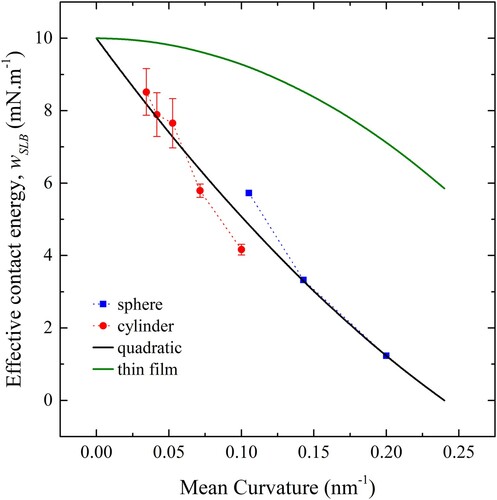
Figure 16. (colour online) Tension vs penetration depth for a sphere (red), cylinder (blue) and cube (green) 10 nm in diameter. Solid lines show predictions from theory, using modified values of .
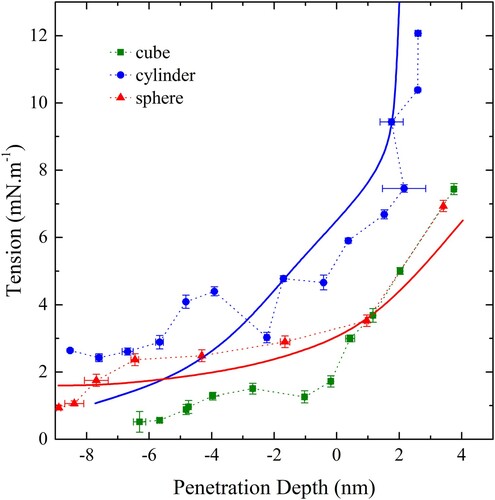
Table 2. Predicted critical diameters for a range of materials for both cylindrical and spherical particles using the modified formulae for finite thickness membranes.
Figure 17. (colour online) Illustration of the finite membrane model showing a cross section schematic of a complete wrapped spherical particle. The particle, 20 nm in diameter, is shown in yellow, the midplane of the bilayer is red and the hydrophilic surfaces of the bilayer are blue.
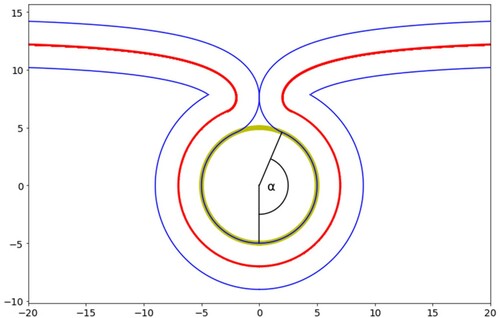
Figure 18. (colour online) The maximum tension for complete wrapping of cylindrical particles as a function of diameter for a range of adhesion strengths.
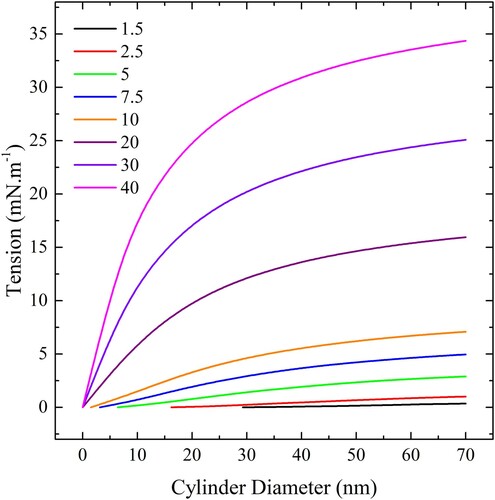
Figure 19. (colour online) The maximum tension for complete wrapping of spherical particles as a function of diameter for a range of adhesion strengths.
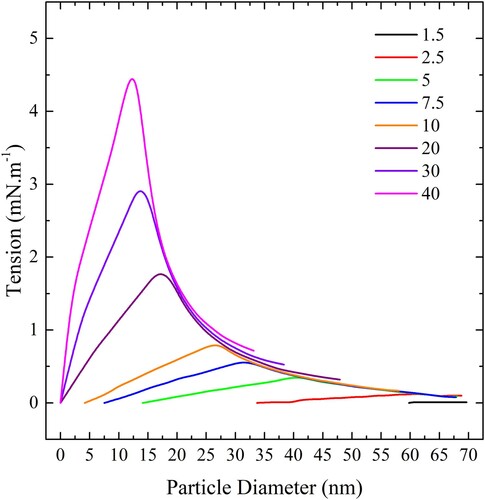
Figure 20. (colour online) Maximum spherical particle concentration, expressed in particles per square nm of bilayer, for complete wrapping over a range of values of adhesion strengths.
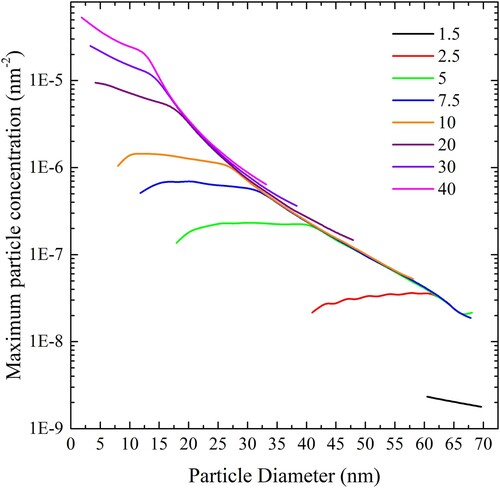
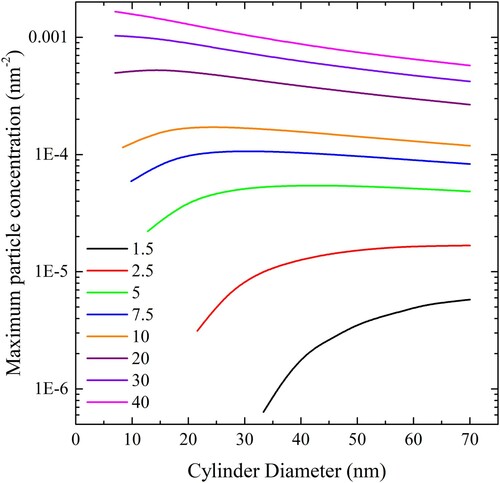
Figure 21. (colour online) Maximum cylindrical particle concentration, expressed in length of cylinder per square nm of bilayer, for complete wrapping over a range of values of adhesion strengths.