Figures & data
Table 1. Management practices, medical conditions, and behavioral/other signals used to assess ridden-horse welfare (in alphabetical order) (adapted from Luke et al., Citation2022).
Figure 1. Scattergrams demonstrating the relationship between rider satisfaction and (A) relative horse welfare score (r = 0.29, p < 0.01), (B) horse ridden hyperreactive behavior (bucking, rearing, bolting, and spooking, r = −0.23, p < 0.01), (C) rider accidents and injuries (r = −0.16, p < 0.001), and (D) rider perception of control while riding (r = 0.49, p < 0.001).
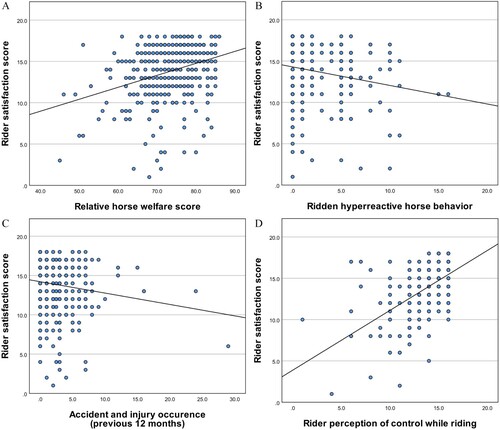
Figure 2. Median relative welfare scores of least favorite and favorite horses. Higher welfare scores indicate better horse welfare. Circles and asterisks denote outliers in the sample.
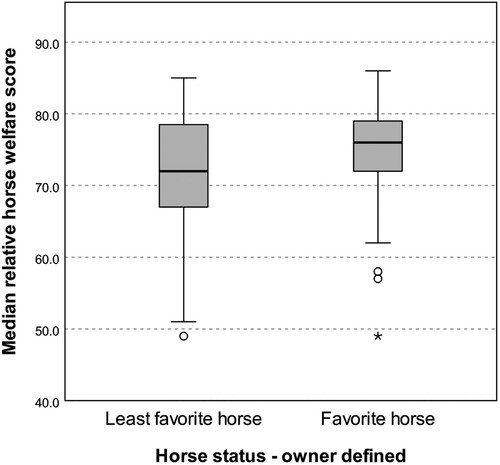
Table 2. Spearman rank correlations between horse welfare, horse hyperreactive behavior, rider safety, rider perceived control, rider goal achievement, and overall rider satisfaction.
Figure 3. Median rider perceived control of least favorite and favorite horses. Circles and asterisks denote outliers in the sample.
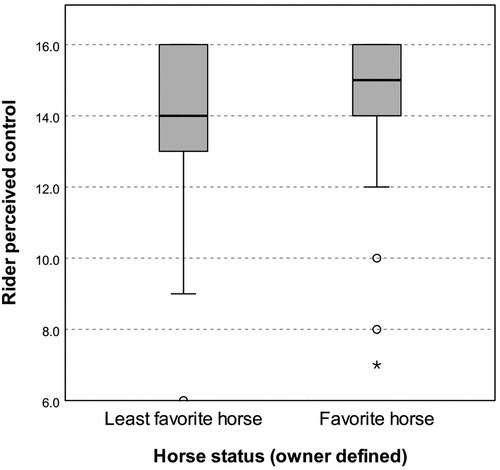
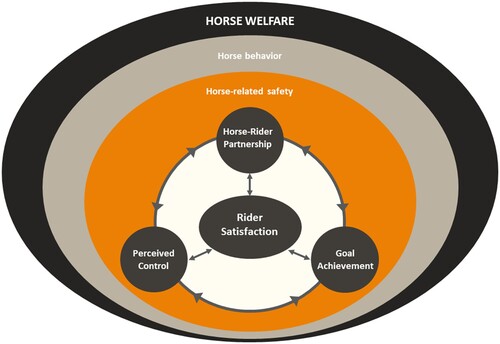
Figure 4. Schematic illustration of the relationships found in this study between horse-rider partnership, equestrian goal achievement, perceived rider control, and rider satisfaction. The diagram shows the variables contributing to rider satisfaction (goal achievement, perceived control, and horse-rider partnership) are also related to, and influenced by, horse-related safety, horse behavior, and horse welfare.