Figures & data
Table 1. Participants’ characteristics.
Table 2. Treatments and support for children with autism spectrum disorder (n = 13)Table Footnotea.
Figure 1. Example stimuli from the pair paradigm (from left to right): human–human, adult individual, child individual, dog individual, and human–dog pair.
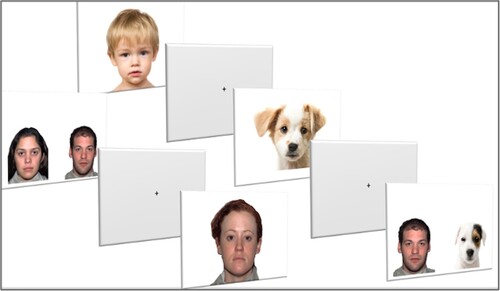
Table 3. Results for individual pictures by group.
Table 4. Pair paradigm results by group.
Figure 2. Dwell time on the area of interest of the eyes in the neurotypical (NT) and autism spectrum disorder (ASD) groups while gazing at faces of adults, children, and dogs. *p < 0.05, **p < 0.01, ***p < 0.001.
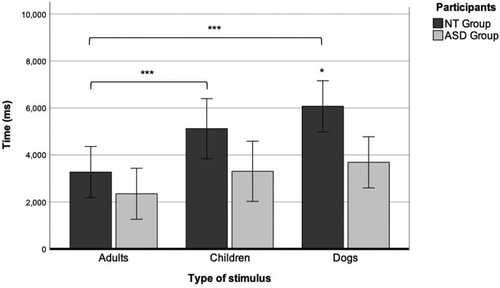
Figure 3. Latency of the first gaze to the eyes in individual faces of adults, children, and dogs. *p < 0.05, **p < 0.01, ***p < 0.001.
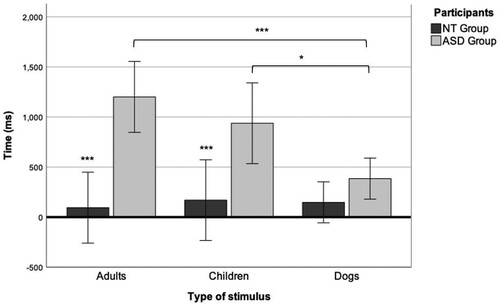
Figure 4. Average continuous gaze time on the eyes in individual faces of adults, children, and dogs. *p < 0.05, **p < 0.01, ***p < 0.001.
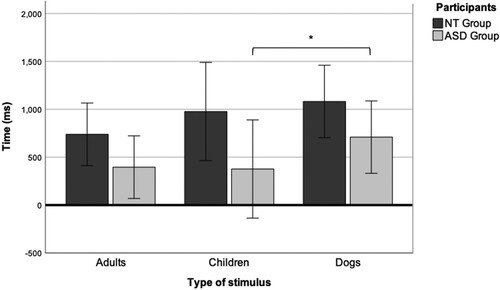
Figure 5. Dwell time according to the side of the screen on which the faces appear (left or right side) and type of stimulus (human or animal) in the neurotypical (NT) and autism spectrum disorder (ASD) groups. *p < 0.05, **p < 0.01, ***p < 0.001.
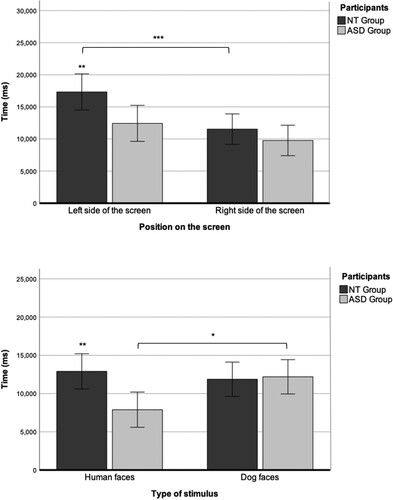
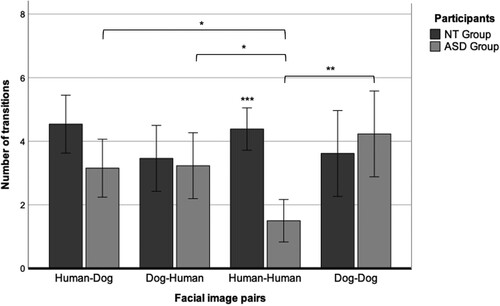
Figure 6. Total transitions between the left and right picture for pairs of stimuli (human–dog, dog–human, human–human, or dog–dog) in neurotypical (NT) and autism spectrum disorder (ASD) children. *p < 0.05, **p < 0.01, ***p < 0.001.