Figures & data
Table 1. Agricultural operation characteristics.
Table 2. Environmental change perceptions and experiences.
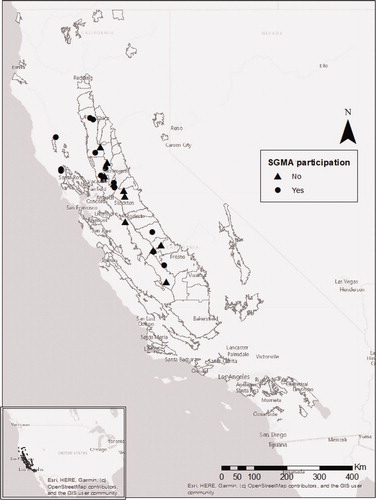
Figure 1. Distribution of interviewees across groundwater basins in California. Map shows the distribution of interviewed farmers and their farm locations within the limits of priority groundwater basins across California. Groundwater basins boundaries are shown in gray polygons; farmers participating in SGMA ("SGMA participants") are represented as dots and farmers not participating in SGMA ("Non-participants") are represented as triangles.