
Figures & data
Table 1. Overview of applications of the social vulnerability protocol.
Table 2. List of ecosystem services identified for the Gila National Forest, New Mexico.
Table 3. List of potential drivers of change on the Gila National Forest, New Mexico.
Figure 1. Divergence and convergence of mean importance scores for ecosystem services across public respondents (n = 122) and agency employee respondents (n = 50) on the Gila National Forest, New Mexico. Notes: Dots represent mean importance for each ecosystem service. Bars represent standard deviations for each ecosystem service.
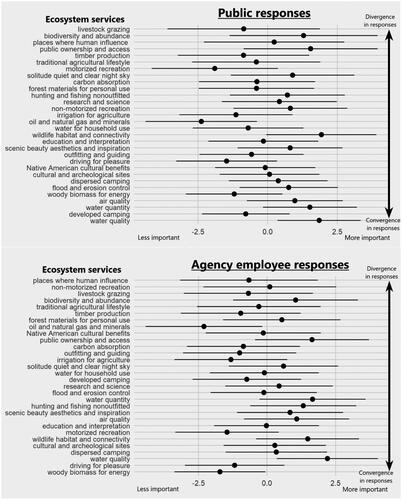
Figure 2. A comparison of interested public and agency employee perspectives. Note: Numbers in each perspective correspond to ecosystem services for the Gila National Forest, New Mexico (see ).
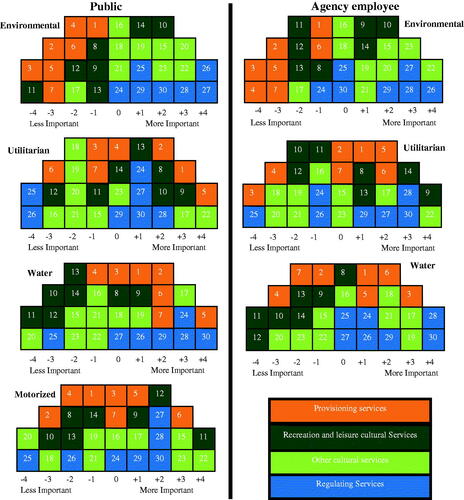
Table 4. Correlations between the different interested public and agency employee perspectives.
Table 5. Percent of each sample selecting driver of change and the strength of associations with each of the public perspectives on Gila National Forest.