2,020
Views
5
CrossRef citations to date
0
Altmetric
Original Research

Successful Treatment of Hypersplenism in Wilson's Disease by Partial Splenic Embolization

, , , &
Pages 75-81 | Received 17 Nov 2016, Accepted 27 Dec 2016, Published online: 31 Jan 2017

Figures & data

FIGURE 1. Brain MRI of a patient with Wilson's disease. A, D: T1WI reveals a symmetric low signal in the bilateral basal ganglia; B, E: T2WI reveals a symmetric high signal in the bilateral basal ganglia; C, F: Axial fluid attenuated inversion recovery (FLAIR) MRI reveals a symmetric high signal in the bilateral basal ganglia.
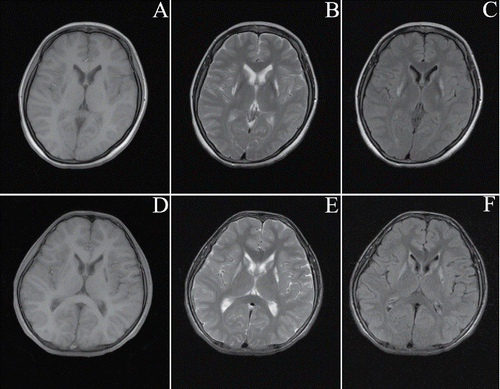
FIGURE 1. Brain MRI of a patient with Wilson's disease. A, D: T1WI reveals a symmetric low signal in the bilateral basal ganglia; B, E: T2WI reveals a symmetric high signal in the bilateral basal ganglia; C, F: Axial fluid attenuated inversion recovery (FLAIR) MRI reveals a symmetric high signal in the bilateral basal ganglia.

TABLE 1. Clinical characteristics of hypersplenic patients with WD before PSE or splenectomy (means ± SDs)

FIGURE 2. Splenic artery angiography before (A, B) and after (C, D) embolization.

FIGURE 2. Splenic artery angiography before (A, B) and after (C, D) embolization.

FIGURE 3. Computed tomography (CT) of the abdomen after embolization. The low-density region represents the infarcted area of the spleen.
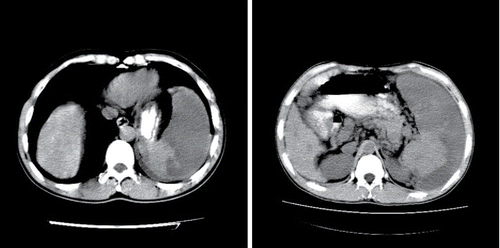
FIGURE 3. Computed tomography (CT) of the abdomen after embolization. The low-density region represents the infarcted area of the spleen.

FIGURE 4. Changes in the WBC and PLT counts before and after PSE (group A, n = 25) or splenectomy (group B, n = 25). Values are expressed as the means ± standard deviations. *Significant increase at the indicated time point (7, 14, 21, 28, or 35 days after the procedure) compared with the pre-PSE or pre-splenectomy values in each group (*P < 0.05).

FIGURE 4. Changes in the WBC and PLT counts before and after PSE (group A, n = 25) or splenectomy (group B, n = 25). Values are expressed as the means ± standard deviations. *Significant increase at the indicated time point (7, 14, 21, 28, or 35 days after the procedure) compared with the pre-PSE or pre-splenectomy values in each group (*P < 0.05).
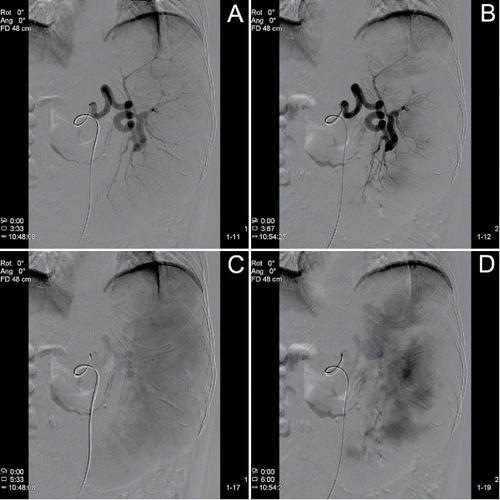
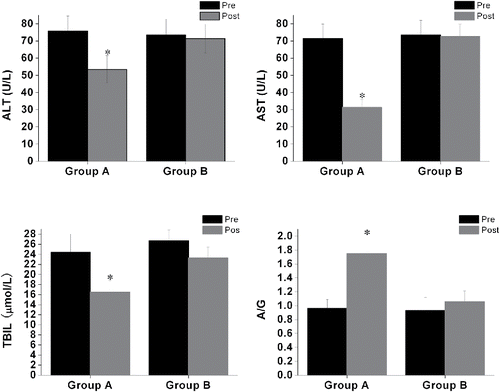
FIGURE 5. Changes in liver function parameters before and after PSE (group A, n = 20) or splenectomy (group B, n = 20). Values are expressed as the means ± standard deviations. Pre: before PSE or splenectomy; post: after PSE or splenectomy (*P < 0.05).

FIGURE 5. Changes in liver function parameters before and after PSE (group A, n = 20) or splenectomy (group B, n = 20). Values are expressed as the means ± standard deviations. Pre: before PSE or splenectomy; post: after PSE or splenectomy (*P < 0.05).