Figures & data
FIGURE 1 Examples of lesions in the porcine renal cortex, 10 mm in diameter and depth (created using a biopsy punch). Image taken after application of the hemostatic agents. A: lesions treated with gelatin–thrombin matrix with smooth particles (SmGM); B: lesions treated with gelatin–thrombin matrix with stellate particles (StGM).
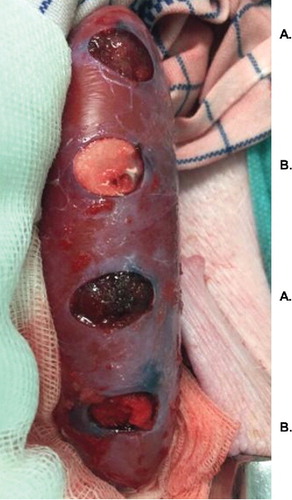
FIGURE 2 Comparison of blood loss in a porcine kidney standardized puncture model: 2, 5 and 10 minutes after application of gelatin–thrombin matrix with smooth particles (SmGM) or gelatin–thrombin matrix with stellate particles (StGM). Horizontal lines and error bars represent median values and interquartile ranges, respectively. One outlying data point (SmGM, 2 minutes post-application; bleeding rate of 7.0 mL/min) is not shown. *p < .0001 (SmGM versus StGM).
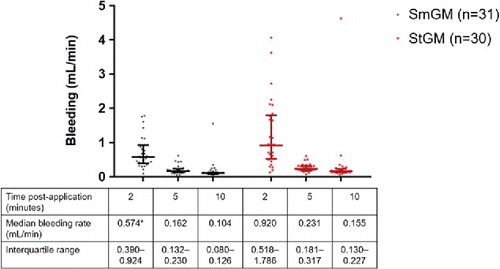
FIGURE 3 Comparison of blood loss in a porcine kidney standardized puncture model: lesions with initial blood rates < 29 mL/min (2, 5 and 10 minutes after application of gelatin–thrombin matrix with smooth particles [SmGM] or gelatin–thrombin matrix with stellate particles [StGM]). Horizontal lines and error bars represent median values and interquartile ranges, respectively. One outlying data point (SmGM, 2 minutes post-application; bleeding rate of 7.0 mL/min) is not shown. *p < .01; **p < .0001 (SmGM versus StGM).
![FIGURE 3 Comparison of blood loss in a porcine kidney standardized puncture model: lesions with initial blood rates < 29 mL/min (2, 5 and 10 minutes after application of gelatin–thrombin matrix with smooth particles [SmGM] or gelatin–thrombin matrix with stellate particles [StGM]). Horizontal lines and error bars represent median values and interquartile ranges, respectively. One outlying data point (SmGM, 2 minutes post-application; bleeding rate of 7.0 mL/min) is not shown. *p < .01; **p < .0001 (SmGM versus StGM).](/cms/asset/525e50cc-bb47-4153-bec8-bc59f3fa45c9/iivs_a_1447619_f0003_c.jpg)
FIGURE 4 Comparison of blood loss in a porcine kidney standardized puncture mode: lesions with initial blood rates ≥29 mL/min (2, 5 and 10 minutes after application of gelatin–thrombin matrix with smooth particles [SmGM] or gelatin–thrombin matrix with stellate particles [StGM]). Horizontal lines and error bars represent median values and interquartile ranges, respectively. *p = 0.040 (SmGM versus StGM).
![FIGURE 4 Comparison of blood loss in a porcine kidney standardized puncture mode: lesions with initial blood rates ≥29 mL/min (2, 5 and 10 minutes after application of gelatin–thrombin matrix with smooth particles [SmGM] or gelatin–thrombin matrix with stellate particles [StGM]). Horizontal lines and error bars represent median values and interquartile ranges, respectively. *p = 0.040 (SmGM versus StGM).](/cms/asset/b53bfffc-f195-4c45-8c23-7484b6a746ad/iivs_a_1447619_f0004_c.jpg)
TABLE 1 Weight measurement analysis of gelatin–thrombin matrix with smooth particles (SmGM) and gelatin–thrombin matrix with stellate particles (StGM).
FIGURE 5 Matrix morphology of the two hemostatic agents. Images from digital light microscopy, performed immediately after reconstitution of each agent.
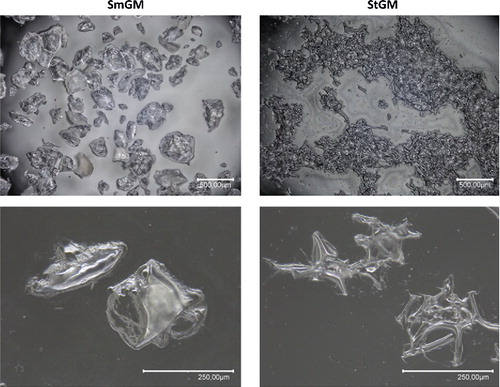
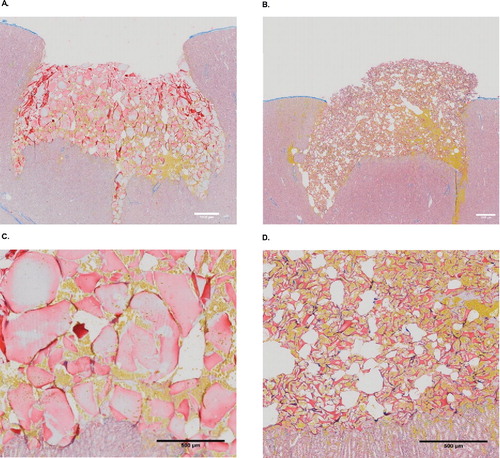
FIGURE 6 Histology of the two hemostatic agents. Images from light microscopy, with Martius-Scarlet-Blue staining. Yellow areas represent fresh fibrin, erythrocytes are stained yellow, and connective tissue is shown in blue. A and C: gelatin–thrombin matrix with smooth particles (SmGM); B and D: gelatin–thrombin matrix with stellate particles (StGM).