Figures & data
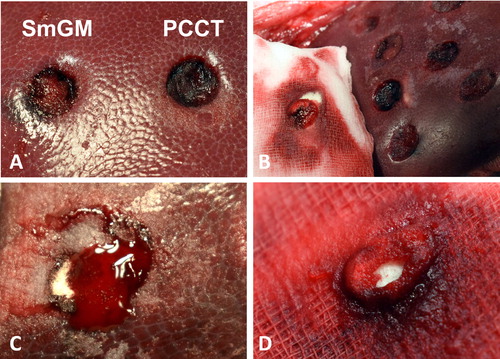
FIGURE 1. Timeline for treatment application, irrigation, and reapplication, together with assessment time points. Lesions were excluded from the study if the initial bleeding rate was ≥20 mL/min.
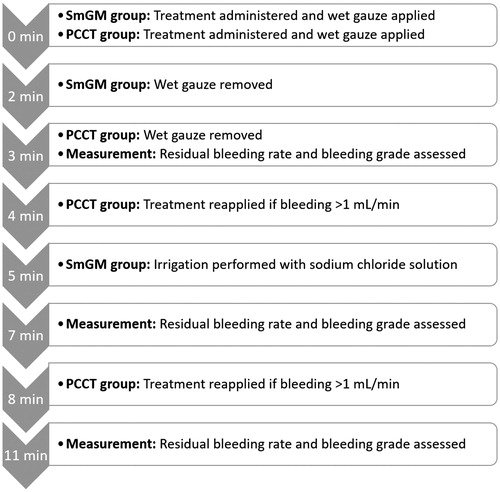
FIGURE 2. Comparison of bleeding rates and grade for all lesions at 3, 7, and 11 minutes after application of the hemostatic agent. Horizontal line and box represent the median and interquartile ranges; error bars represent maximum/minimum values. Left side: residual bleeding rate for PCCT and SmGM. Right side: bleeding grades for PCCT and SmGM.
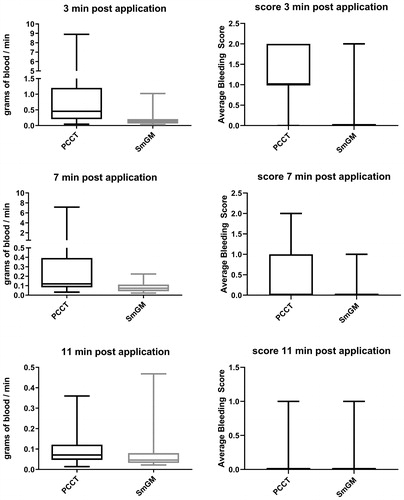
FIGURE 3. Comparison of bleeding rates and grade for lesions with an initial bleeding rate lower than 8.1 mL/min at 3, 7, and 11 minutes after application of the hemostatic agent. Horizontal line and box represent the median and interquartile ranges; error bars represent maximum/minimum values. Left side: residual bleeding rate for PCCT and SmGM. Right side: mean bleeding grades for PCCT and SmGM.
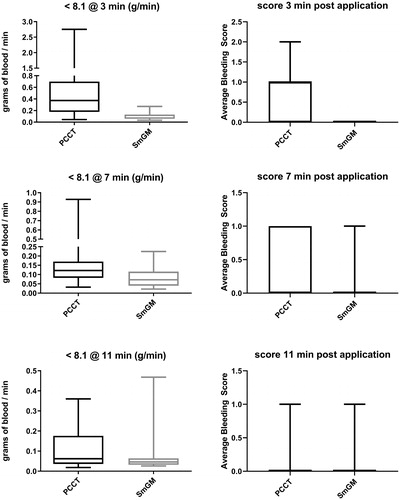
FIGURE 4. Comparison of bleeding rates and grade for lesions with an initial bleeding rate higher than 8.1 mL/min at 3, 7, and 11 minutes after application of the hemostatic agent. Horizontal line and box represent the median and interquartile ranges; error bars represent maximum/minimum values. Left side: residual bleeding rate for PCCT and SmGM. Right side: mean bleeding grades for PCCT and SmGM.
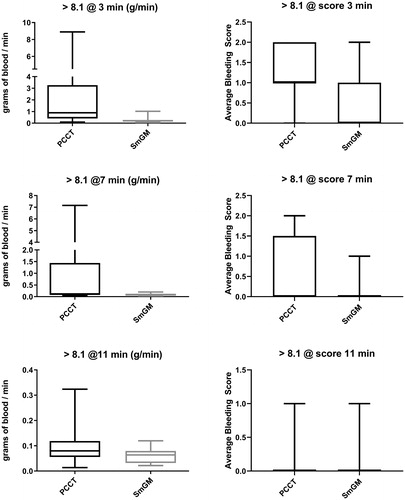
FIGURE 5. Representative histologic samples for (A) SmGM and (B) PCCT, depicting the bottom corner of the defect. Samples are stained for fibrin (red), fresh fibrin (yellow), erythrocytes (yellow), connective tissue (blue), and collagen (blue).
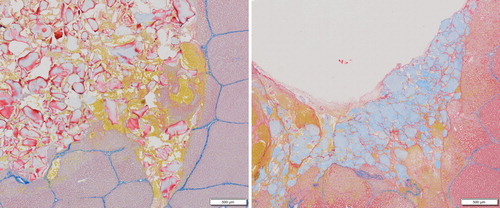
FIGURE 6. Number of reapplications for PCCT. Of the 32 lesions treated with PCCT, 10 required a reapplication after 4 minutes, and 3 required a second reapplication after 8 minutes. No reapplications were performed for SmGM.
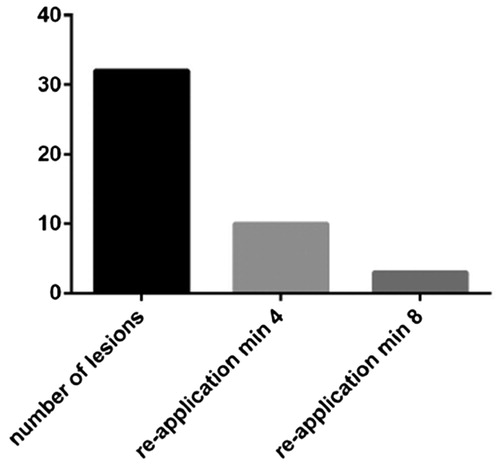
FIGURE 7. (A) Left: liver punch biopsy lesion treated with SmGM. Right: Liver punch biopsy lesion treated with PCCT. (B) PCCT material residues sticking to the wet gauze used for approximation. (C) Residual bleeding after application of PCCT. The lesion is filled with partially white, non-saturated powder, demonstrating a limited absorption capacity for blood. (D) PCCT residues sticking to the gauze after approximation. Note the blood-soaked gauze and the dry, non-soaked core of the powder.