Figures & data
Table 1. The validated intraoperative bleeding scale (VIBe SCALE).
Table 2. Initial bleeding rates in non-heparinized and heparinized animals.
Figure 1. Comparison of time to hemostasis – all initial bleeding rates within intended range (≤10 g/min).
ORC, oxidized regenerated cellulose; rT, recombinant thrombin. Horizontal line and box represent the median and interquartile ranges; error bars represent maximum/minimum values.
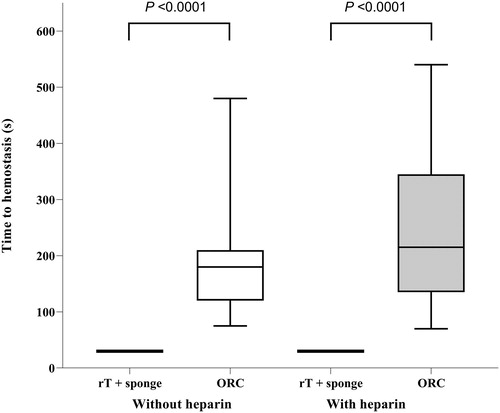
Table 3. Time to hemostasis and number of applications by treatment in non-heparinized and heparinized animals.
Figure 2. Proportion of active bleeding events over time – all initial bleeding rates within intended range (≤10 g/min).
ORC, oxidized regenerated cellulose; rT, recombinant thrombin.
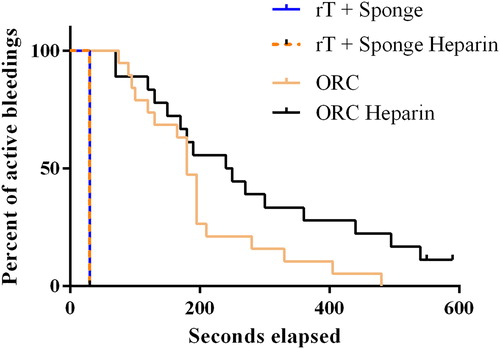
Figure 3. Comparison of time to hemostasis – A. Initial bleeding rates ≤5 g/min (VIBe SCALE grade 1), and B. Initial bleeding rates >5–10 g/min (VIBe SCALE grade 2). A. B. ORC, oxidized regenerated cellulose; rT, recombinant thrombin. Horizontal line and box represent the median and interquartile ranges; error bars represent maximum/minimum values.
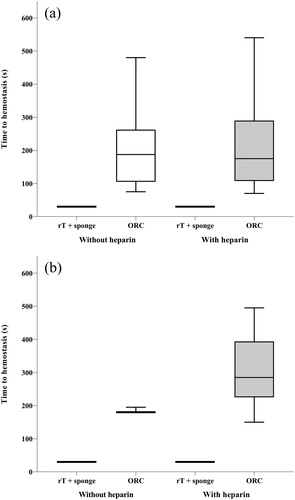
Figure 4. Test samples post application.
ORC, oxidized regenerated cellulose; rT, recombinant thrombin plus gelatin sponge on the left, ORC on the right, after 3 layers have been applied.
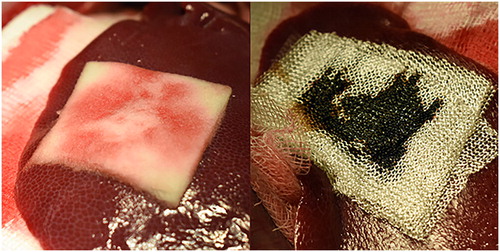
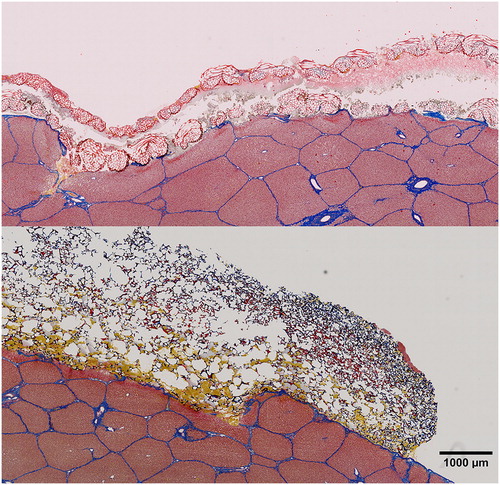
Figure 5. Martius, Scarlet and Blue staining of ORC (top) and rT plus gelatin sponge carrier (bottom).
ORC, oxidized regenerated cellulose; rT, recombinant thrombin.
Orange-yellow coloring represents fresh fibrin, red represents mature fibrin, erythrocytes are stained yellow, and connective tissue is shown in blue.
Liver tissue can be seen in the lower part of each picture with the patch material covering the superficial organ defect on top. Note the spongious structure of the gelatin sponge carrier that has been partially penetrated with blood in the lower regions, whereas ORC shows significant amounts of coagulated blood between the individual layers and blood penetration throughout the top layer.