
Figures & data
Figure 1. In vitro benchtop balloon dilation of the anisotropic (test) conduit. A 10 mm test conduit is dilated with a 20 mm catheter based balloon to its final diameter of 21.5 mm. Wall tension was not calculated during this test. The black thumb drive is in the image for perspective, measuring 4.5 cm x 1.5 cm.
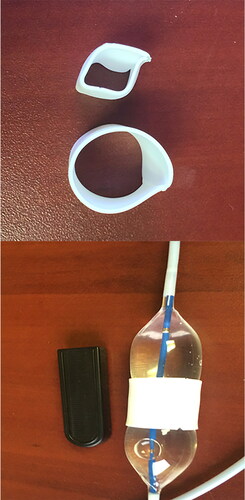
Table 1. Verification of Test conduit expansile properties with a pressurized balloon catheter with reference to corresponding patient size.
Table 2. Animal weight.
Table 3. Assessment of cardiac function using transthoracic echocardiography at 3 and 6 months after implant of the Test and Control conduits.
Figure 2. Angiograms of a control conduit at 3 months post-implant. There is severe obstruction of the pulmonary outflow at the interposition graft insertion site with the conduit diameter measuring approximately 9 mm.
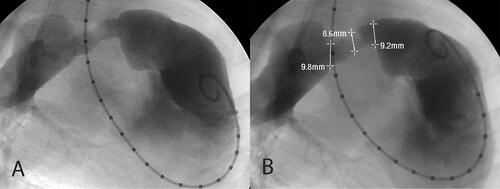
Figure 3. Angiograms of Test conduits at 3 months post-implant. shows the test conduit as an interposition graft in the main PA. The conduit measures approximately 16 mm along its entire length from proximal to distal anastomosis, spontaneously expanding from its baseline insertion diameter of 10–11 mm. shows a representative angiogram of a test conduit sewn from a right ventriculotomy to the PA. There is no contour deformity, nor obstruction of the RVOT. Angiographic images were collected with an OEC 9900 Elite C-Arm positioned at AP 0° with the animal in the right decubitus position.
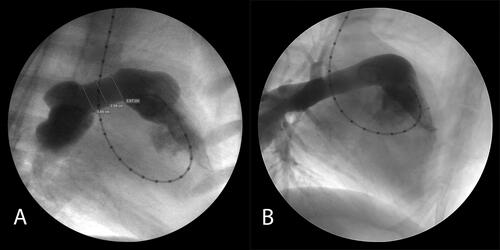
Table 4. Assessment of cardiac function using intracardiac catheterization at 3 and 6 months after implant of the Test and Control conduits.