
Figures & data
Figure 1. Scanning electron micrograph (SEM) of Phasix™ ST Mesh (40× magnification; scale bar = 200 µm). Phasix™ ST Mesh is comprised of fully resorbable poly-4-hydroxybutyrate (P4HB) fibers co-knitted with polyglycolic acid (PGA) and coated with a resorbable hydrogel layer on the visceral side of the mesh. The hydrogel layer is comprised of sodium hyaluronate (HA), carboxymethylcellulose (CMC), and polyethylene glycol (PEG).
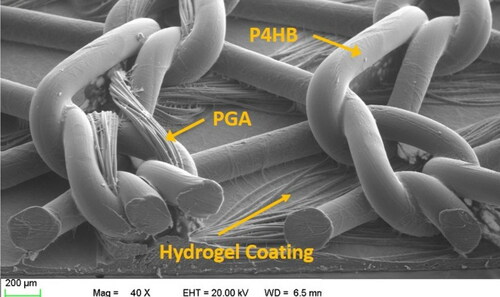
Figure 2. Simulated hernia defects surgically created in the midline of Yucatan pigs: (A) 4 cm defect group, unclosed; (B) 8 cm defect group, unclosed; (C) 8 cm buttress group prior to closure; and (D) 8 cm buttress group after closure.
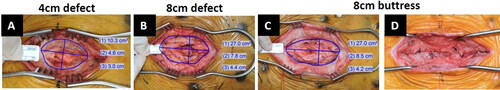
Figure 3. 4 cm unclosed repair immediately after defect closure and fixation of mesh using SorbaFix™ Absorbable Fixation System fasteners in a double crown technique.
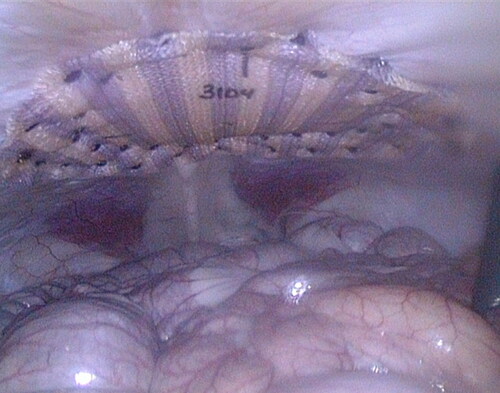
Table 1. Morphometric evaluation of defect area, length, and width demonstrating successful creation of consistent surgical defects.
Figure 4. Phasix™ ST Mesh at 48 weeks (top row) and 72 weeks (bottom row) postimplantation. Inset photos depict Phasix™ ST Mesh after collagenase digestion of adherent native tissue. Phasix™ ST Mesh remained intact at 48 weeks, but only low molecular weight fragments remained at 72 weeks.
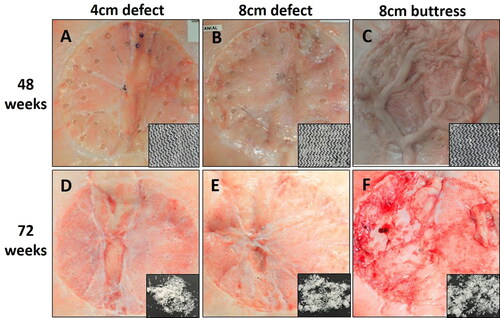
Figure 5. Ball burst strengths of Phasix™ ST Mesh-repaired sites (mean ± standard error of the mean). Dashed line represents Deeken-Matthews recommended 72 N strength threshold [Citation13] (*p < 0.05 relative to T0).
![Figure 5. Ball burst strengths of Phasix™ ST Mesh-repaired sites (mean ± standard error of the mean). Dashed line represents Deeken-Matthews recommended 72 N strength threshold [Citation13] (*p < 0.05 relative to T0).](/cms/asset/9e57f63a-1844-444c-a7ab-1c66ab667b50/iivs_a_1830318_f0005_b.jpg)
Figure 6. Molecular weight (mean ± standard deviation) of explanted Phasix™ ST Mesh compared to non-implanted (T0) samples (*p < 0.05 relative to T0).
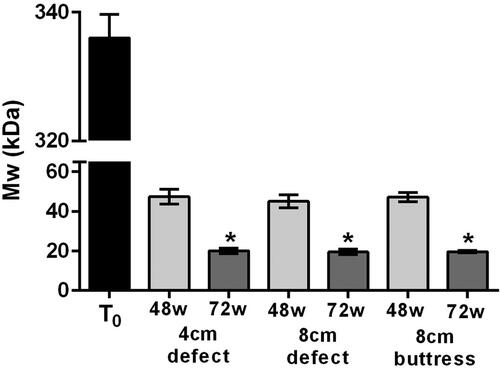
Figure 7. Hematoxylin & Eosin (H&E), Masson’s Trichrome (MT), and Picrosirius Red (PSR) stained slides of Phasix™ ST Mesh-repaired sites at 48 and 72 weeks postimplantation, taken from the center of the defect (scale bar = 500 µm). For a given defect size and time point depicted in a single row, all three images were taken from the same tissue block derived from a single animal. Local tissue response was histologically comparable between groups, regardless of defect type/length and time point. H&E slides show minimal mesh-associated inflammation, consisting of macrophages, lymphocytes, and giant cells, with few eosinophils. MT slides demonstrate mature and well organized fibrotic (collagen) and fibrovascular tissue around and within all segments of the Phasix™ ST Mesh interstices, including the segment of the mesh overlying the defect. PSR slides depict predominantly mature, type I collagen (red-orange) with minimal immature, type III collagen (green).
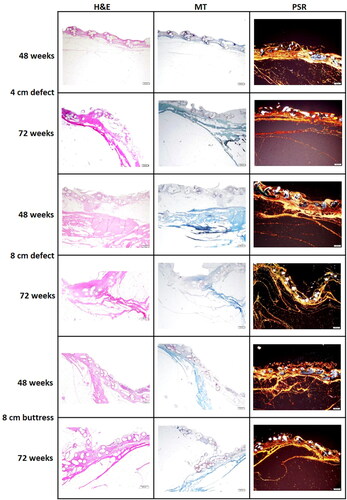
Figure 8. Hematoxylin & Eosin (H&E) stained slides obtained to the left, center, and right of the 8 cm unclosed defect site (72 weeks postimplantation). The left, center, and right locations denoted in the top panel indicate the approximate location of the slides displayed in the bottom panel; A = Mesh/Peritoneal Surface, B = Preperitoneal Fat and Abd Muscle = Abdominal Muscle. Comparable mature collagen/fibrovascular tissue was observed around and within the Phasix™ ST Mesh interstices, including the segment of mesh overlying the defect.

Table 2. Median scores for key histomorphological parameters: Inflammation, fibrosis, neovascularization, and collagen morphology shown for all three defect types and both time points.
Table 3. Comparison of measured ball burst and molecular weight data with predicted mesh and host tissue contributions.