
Figures & data
Table 1. Experimental design and data collection events.
Figure 1. Photograph of the annuloplasty ring used in the modified aortic annuloplasty procedure.
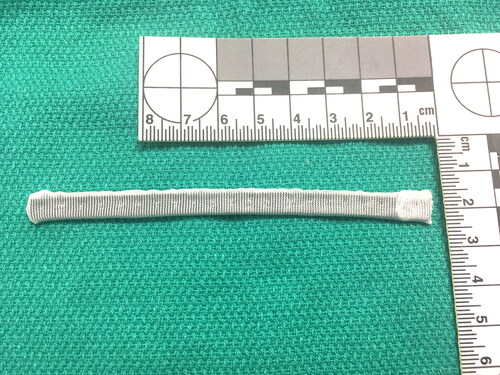
Figure 2. presents an illustration of how the annuloplasty ring sections are sewn to the aortic annulus. is a photograph of the newly created modified aortic annulus immediately after implant, as viewed from the left ventricle outflow tract.
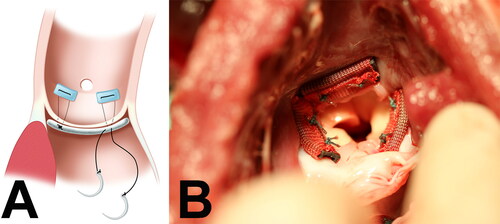
Table 2. Transthoracic echo data at 14 and 60 days post-MAA collected on Test and Control group animals.
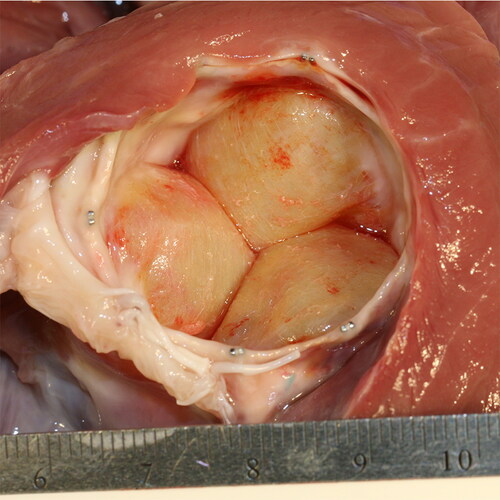
Figure 3. Photograph of annuloplasty ring segments healed into the aortic annulus in a Control group animal at 60-day gross exam. Note the fibrous appearance of the ring segments and the circumferential scarring of the left ventricle outflow tract and aortic annulus.
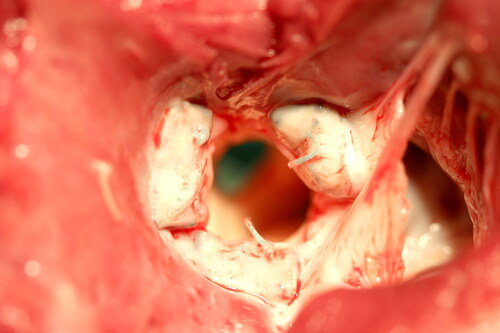
Figure 4. Fluoroscopic images obtained during TAVR device deployment. presents an angiogram collected prior to TAVR insertion. Note the modified aortic annulus (white arrow) with aortic insufficiency present (arrow head). presents a post-insertion angiogram with the TAVR device seated within the modified aortic annulus (white arrow). Note that aortic insufficiency is no longer present (arrow head) following TAVR insertion.
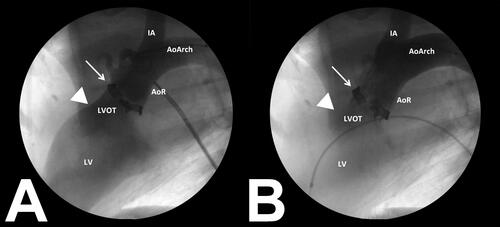
Figure 5. Photograph of the TAVR device healed into the modified annulus in a Test group animal at 140 day gross examination.
Data availability statement
The data that support the findings of this study are available from the corresponding author, JPC, upon reasonable request.