
Figures & data
Table 1. Patient demographic characteristics.
Figure 1. Correlation analysis of procalcitonin and other factors in the shock phase of extensive burns. TBSA: total body surface area; Burn index: full thickness TBSA + 1/2 partial thickness TBSA; APACHE II score: Acute Physiology and Chronic Health Evaluation II; SOFA Score: Sequential Organ Failure Assessment Score; r value: correlation coefficient. *p < 0.05, **p < 0.01, ***p < 0.001.
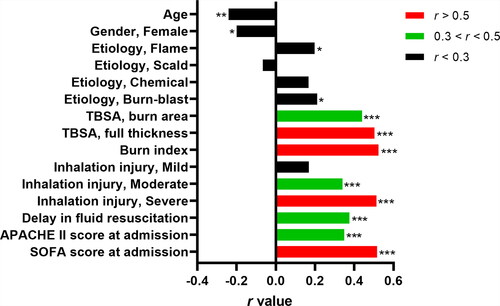
Figure 2. Procalcitonin levels between survivors and non-survivors during shock and infection phases. (a): shock phase; (b) infection phase. Mann-Whitney U test. Data are expressed as median (interquartile range). PCT: procalcitonin; PCT-SP: The maximum concentration of PCT during the shock phase after burn injury; PCT-IP: The maximum concentration of PCT during the infection phase after burn injury.
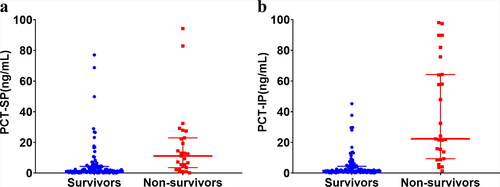
Table 2. Correlation analysis between PCT and mortality.
Figure 3. Receiver operating characteristic (ROC) curves of procalcitonin during shock and infection phases for predicting death in severe burn patients. (a) shock phase; (b) infection phase. PCT: procalcitonin; PCT-SP: The maximum concentration of PCT during the shock phase after burn injury; PCT-IP: The maximum concentration of PCT during the infection phase after burn injury.
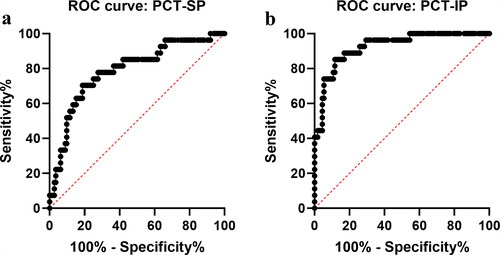
Figure 4. Kaplan-Meier survival analysis based on procalcitonin concentrations in the shock phase of extensive burns. PCT: procalcitonin; PCT-SP: The maximum concentration of PCT during the shock phase after burn injury.
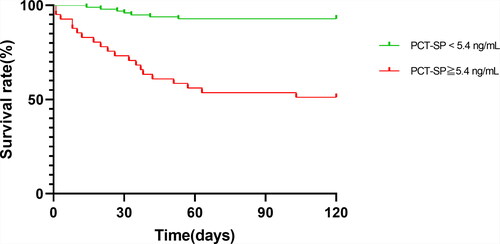
Table 3. Clinical outcomes.
Table 4. Multiple logistic regression.
Table 5. The clinical parameters of typical cases.