
Figures & data
Table 1. Clinopathological characteristics of patients.
Figure 1. Recurrence rates of patients with different prognostic risk groups. (A) The MIS group. (B) The open surgery group.
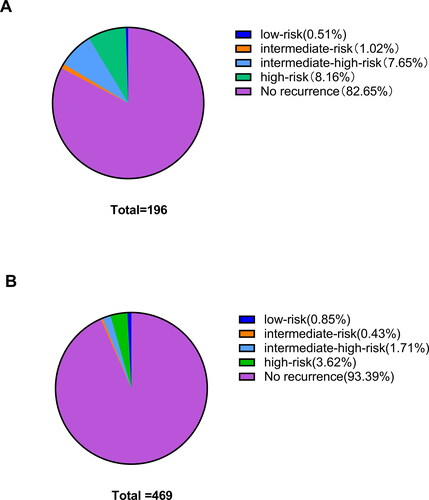
Figure 2. Recurrences site of patients with different surgical approaches. (A) The MIS group. (B) The open surgery group.
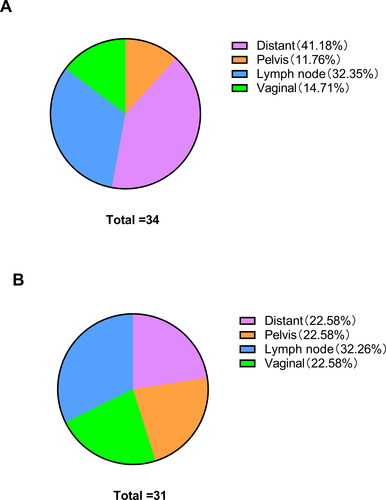
Table 2. Oncologic outcomes of patients.
Table 3. Univariate analysis of influence on recurrence.
Table 4. Multivariate logistic regression analysis of recurrence.
Figure 3. Nomogram for recurrence risk.
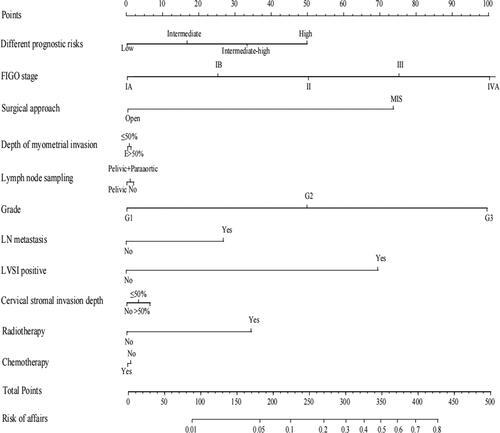
Figure 4. Overall survival in different prognostic risk groups. (A) Overall survival in low-risk group. (B) Overall survival in intermediate-risk group. (C) Overall survival in intermediate-high-risk group. (D) Overall survival in high-risk group.
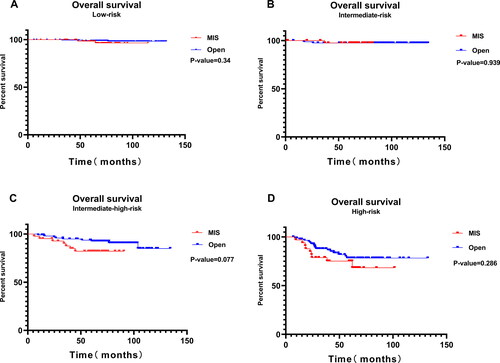
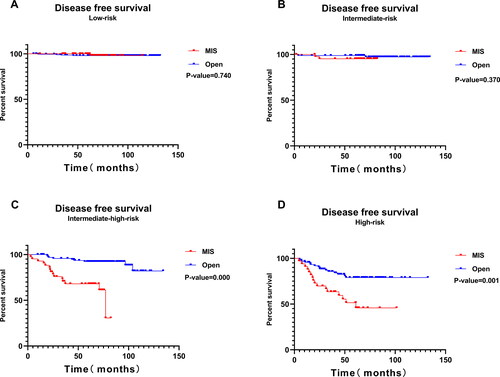
Figure 5. Disease free survival in different prognostic risk groups. (A) Disease free survival in low-risk group. (B) Disease free survival in intermediate-risk group. (C) Disease free survival in intermediate-high-risk group. (D) Disease free survival in high-risk group.
Data availability statement
Data are available upon reasonable request. The data that supporting the findings of this study is available from the corresponding author upon reasonable request.