Figures & data
Figure 1. Evaluations of oxidative stress and antioxidant alterations in the lungs of septic rats treated with suberosin. (A) GSH activities of all experimental groups. φ: Compared to the control group; *: compared to the CLP group. (B) SOD activities of all experimental groups. φ: Compared to the control group; *: compared to the CLP group. (C) MDA levels of all experimental groups. φ: Compared to the control group; *: compared to the CLP group.
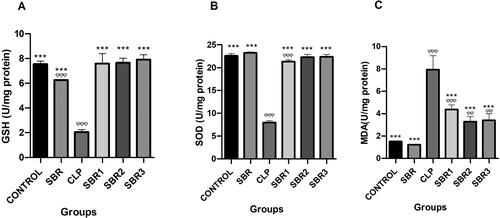
Figure 2. mRNA expressions of TNF-α and IL-1β in rat lungs. φ: Compared to the control group; *: compared to the CLP group.
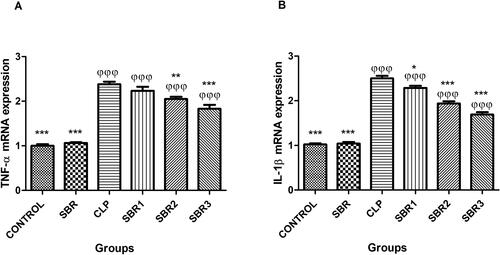
Figure 3. Histopathological examination of lungs of septic rats (magnification 40×). (A) Lung tissue of the control group with normal histological appearance (H&E, bar = 50 µm). (B) Lung tissues of the CLP group with very severe peribronchiolar cell infiltration (empty stars), very severe desquamation in bronchiolar epithelium (arrowheads), and very severe venous hyperemia (H&E, bar = 50 µm). (C) Lung tissue of the SBR1 group with severe peribronchiolar cell infiltration (empty stars), severe interalveolar septum thickening (black stars), moderate desquamation of bronchial epithelium (arrow heads), and severe venous hyperemia (H&E, bar = 50 µm). (D) Lung tissue of the SBR2 group with moderate peribronchiolar cell infiltration (empty stars), moderate interalveolar septum thickening (black stars), moderate desquamation of bronchial epithelium (arrow heads), and moderate venous hyperemia (H&E, bar = 50 µm). (E) Lung tissue of the SBR3 group with mild interalveolar septum thickening (black star), mild desquamation of bronchial epithelium (arrow head), and moderate venous hyperemia (H&E, bar = 50 µm). (F) Lung tissue of the SBR group with normal histological appearance (H&E, bar = 50 µm).
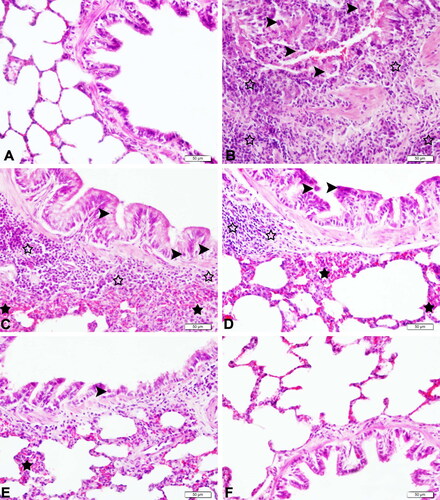
Table 1. Histopathological results and immunohistochemically evaluation of lung tissues.
Table 2. Histopathological and immunohistochemical changes in lung injury.
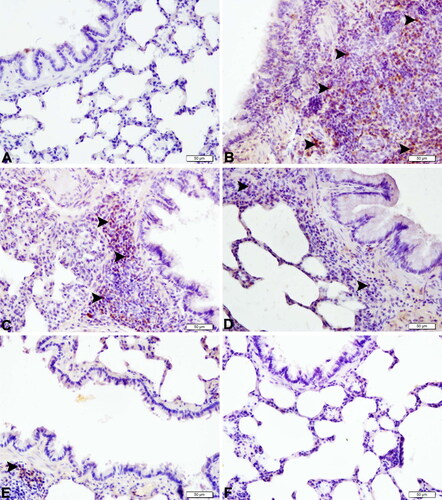
Figure 4. Expressions of TNF-α in lung tissues of septic rats (magnification 40×). (A) Lung tissue of the control group with negative TNF-α protein expression (IHC-P, bar = 50 µm). (B) Lung tissue of the CLP group with very severe TNF-α protein expression (arrowheads) (IHC-P, bar = 50 µm). (C) Lung tissue of the SBR1 group with severe TNF-α protein expression (arrowheads) (IHC-P, bar = 50 µm). (D) Lung tissue of the SBR2 group with moderate TNF-α protein expression (arrowheads) (IHC-P, bar = 50 µm). (E) Lung tissue of the SBR3 group with mild TNF-α protein expression (arrowhead) (IHC-P, bar = 50 µm). (F) Lung tissue of the SBR group with negative TNF-α protein expression (IHC-P, bar = 50 µm).
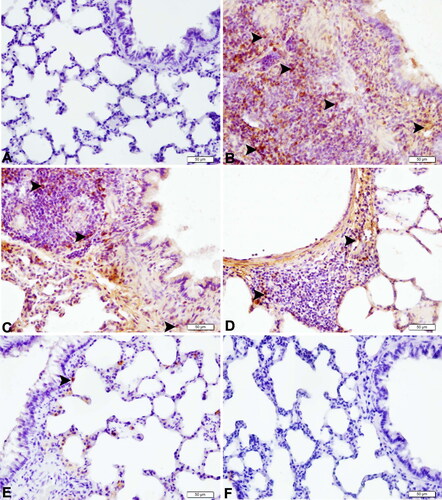
Figure 5. Expressions of IL-1β in lung tissues of septic rats (magnification 40×). (A) Lung tissue of the control group with negative IL-1β protein expression (IHC-P, bar = 50 µm). (B) Lung tissue of the CLP group with very severe IL-1β protein expression (arrowheads) (IHC-P, bar = 50 µm). (C) Lung tissue of the SBR1 group with severe IL-1β protein expression (arrowheads) (IHC-P, bar = 50 µm). (D) Lung tissue of the SBR2 group with moderate IL-1β protein expression (arrowheads) (IHC-P, bar = 50 µm). (E) Lung tissue of the SBR3 group with mild IL-1β protein expression (arrowhead) (IHC-P, bar = 50 µm). (F) Lung tissue of the SBR group with negative IL-1β protein expression (IHC-P, bar = 50 µm).