Figures & data
Figure 1. Biochemical indicators in serum and histological abnormalities in the kidneys associated with SAP. (a, b) Lipase and amylase serum activity; (c, d) serum TNF-α and IL-6 levels; (e, f) serum Cr and BUN levels; (g) representative images of H&E-stained kidney sections (original magnification, ×200) indicating tubular epithelial swelling (green arrow), dilation of the tubular lumen (red arrow), and interstitial edema (black arrow). The data are presented as mean ± SD (n = 5). **p < 0.01 vs. the Sham group; &&p < 0.01 vs. the SAP group.
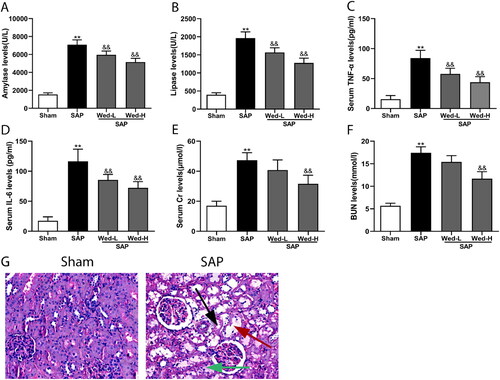
Figure 2. GSDMD proteins and caspase-11 expression in the kidney were detected by immunohistochemical staining. (a, b) Representative images of caspase-11 and GSDMD protein immunolabelling (original magnification, ×200). (c, d) Quantitative analysis of caspase-11 and GSDMD expression by Image-Pro Plus software. All data are presented as mean ± SD (n = 5). &&p < 0.01 vs. the SAP group; **p < 0.01 vs. the Sham group.
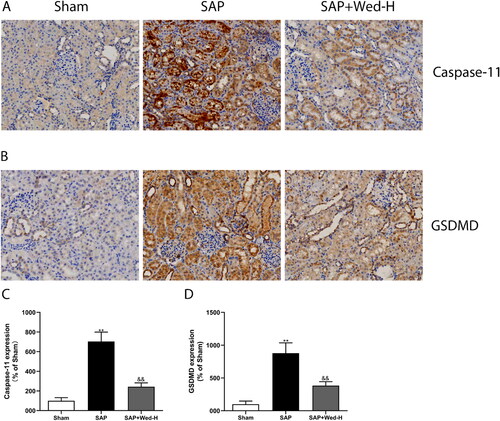
Figure 3. Western blot analysis of pyroptosis core proteins (a). The relative expression of caspase-11, caspase-11 P20, GSDMD, and GSDMD-N was determined by optical densitometry (b-e). All results are presented as the mean ± SD (n = 5). **p < 0.01 vs. the Sham group; &&p < 0.01 vs. the SAP group.
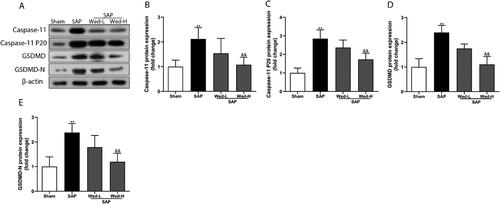
Figure 4. Renal IL-1β and IL-18 levels. (a, b) IL-1β and IL-18 levels in kidney tissues were assessed using ELISA. The data are presented as the mean ± SD (n = 5). **p < 0.01 vs. the Sham group; &p < 0.05 vs. the SAP group; &&p < 0.01 vs. the SAP group.
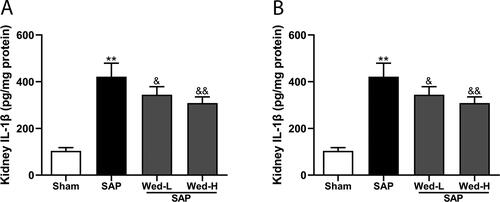
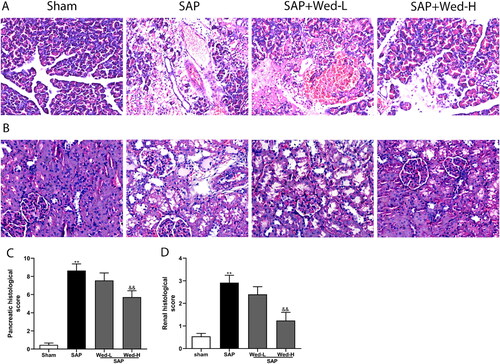
Figure 5. Effects of Wed treatment on the pancreatic and kidney histological abnormalities in rats following SAP. Representative images of kidney and pancreas sections stained with H&E (original magnification, ×200). (a) Pancreas pathology; (b) kidney pathology; (c, d) pancreatic and renal tissue pathological grades. The data are presented as the mean ± SD (n = 5). **p < 0.01 vs. the Sham group; &&p < 0.01 vs. the SAP group.