Figures & data
Figure 1. The TEWL and SCH of S1, S2, and S3. (A) TEWL. (B) SCH. This study explored the barrier function of the skin based on TEWL and SCH, the two most used indicators for evaluating epidermal barrier functions. S1, primary skin; S2, secondary skin; S3, tertiary skin; TEWL, transepidermal water loss; SCH, stratum corneum water content. Scale bars, 50 μm. *p < 0.05,**p < 0.01. n = 6. Data shown as mean ± SD.
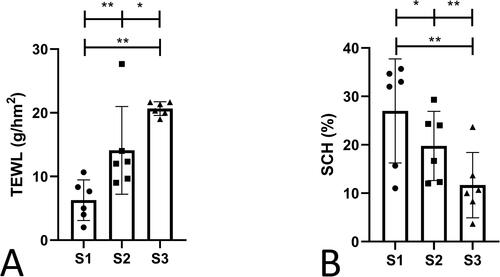
Figure 2. Histopathological observation of the skin. S1, primary skin; S2, secondary skin; S3, tertiary skin; Red arrows indicate melanocytes. Scale bars, 50 μm.
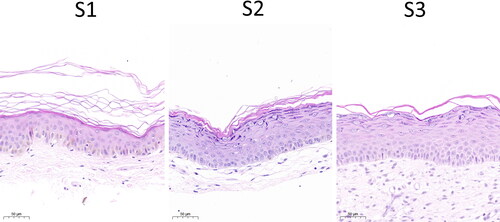
Figure 3. The expressions of structural proteins indicating epidermal stratum corneum barriers and the structural lipids. A. filaggrin. B. involucrin. C. loricrin. D. SPRR3. E. observation of epidermal lamellar bodies. F. expression analysis of structural proteins indicating epidermal stratum corneum barriers. The stratum corneum barrier structure of the skin consists of a variety of proteins and structural lipids. The distribution and expression of filaggrin, loricrin, involucrin and SPRR3 were employed to evaluate the proteins, and the density of lamellar bodies was used to evaluate the structural lipids. S1, primary skin; S2, secondary skin; S3, tertiary skin. Brown staining indicates target protein expression. Red arrows indicate lamellar bodies. Scale bars are shown at the bottom of each figure. *p < 0.05, **p < 0.01. n = 6. Data shown as mean ± SD.
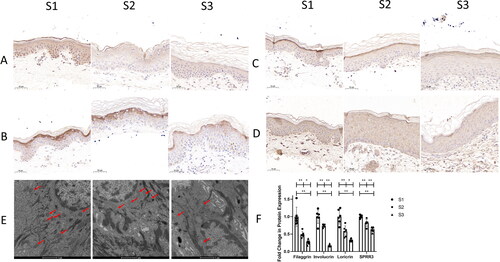
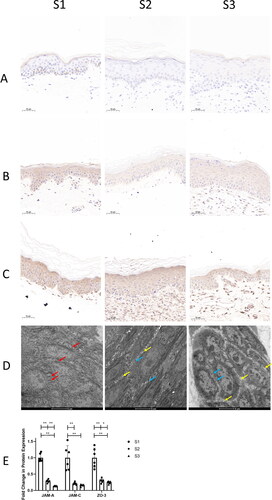
Figure 4. The expression of epidermal tight junction proteins and observation of epidermal tight junction. A. JAM-A. B. JAM-C. C. ZO-3. D. observation of tight junctions in the epidermis. E. the expression of epidermal tight junction proteins. JAM-A, JAM-C, and ZO-3 were used to analyze the distribution and expression of tight junctions. S1, primary skin; S2, secondary skin; S3, tertiary skin. Brown staining indicates target protein expression. Yellow arrows indicate vacuoles. Blue arrows indicate tight junction breaks. Scale bars are shown at the bottom of each figure. *p < 0.05, **p < 0.01. n = 6. Data shown as mean ± SD.