
Figures & data
Table 1. The clinical features of cases which were included in training cohort and validation cohort.
Table 2. Clinical data of lymph node metastasis and lymph node resection.
Table 3. Result of univariate and multivariate analysis for risk of lymph node metastasis.
Figure 1. The procedure of inclusion and exclusion.
Description: Both training cohort (n = 571) and validation cohort (n = 351) met the same criteria.
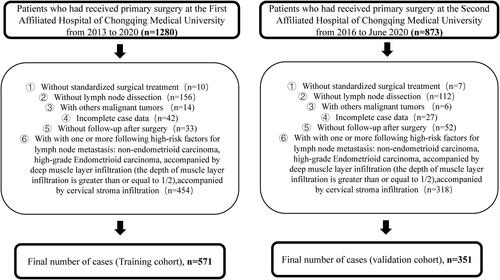
Figure 2. ROC curve of combined ratio and other single-factor models.
Description: ROC curve suggests that the area under the curve (AUC) of combined ratio which defined as the value of (ERα + PR)/(Ki67 + P53) is the largest. The values are recorded in . The area under the curve (AUC) value at the black dot is the highest. And the dot stands for the value here is the best threshold of the combined ratio for predicting lymph node metastasis. The best cutoff value of the combined ratio can be obtained as 1.38 in training cohort, while in validation cohort can be obtained as 1.40. Abbreviations: CA125, carbohydrate antigen 125; LVSI, lymphatic vascular invasion; ERα, estrogen receptor α; PR, progesterone receptor.
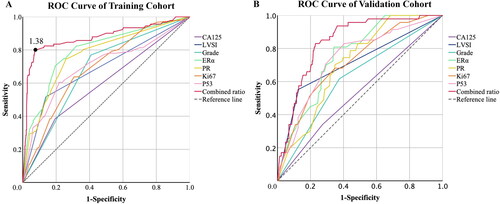
Table 4. Area under the ROC curve of models constructed with combined ratio and other single factors in prediction of lymph node metastasis.
Figure 3. Kaplan-Meier analysis of differences in survival of patients stratified by the cutoff value.
Description: We used the combined ratio which obtained in training cohort to divide patients with a follow-up times at least two years into low-risk group and high-risk group. The training cohort: 314 cases in low-risk group and 75 cases in high-risk group. The validation cohort: 266 cases in low-risk group and 85 cases in high-risk group. (A) RFS curve of cohorts grouped by the combined ratio in training cohort. (B) OS curve of cohorts grouped by the combined ratio in training cohort. (C) RFS curve of cohorts grouped by the combined ratio in validation cohort. (D) OS curve of cohorts grouped by the combined ratio in validation cohort.
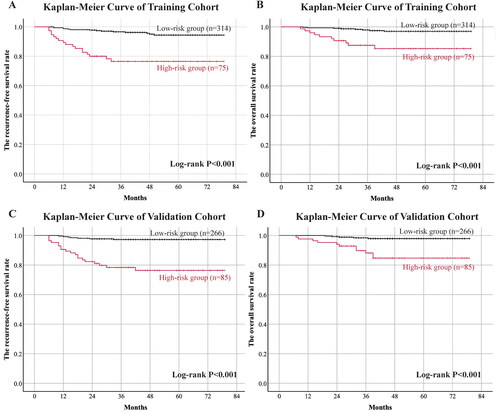
Table 5. The survival rates of high-risk and low-risk group in training and validation cohorts.