
Figures & data
Figure 1. Experimental flow chart.
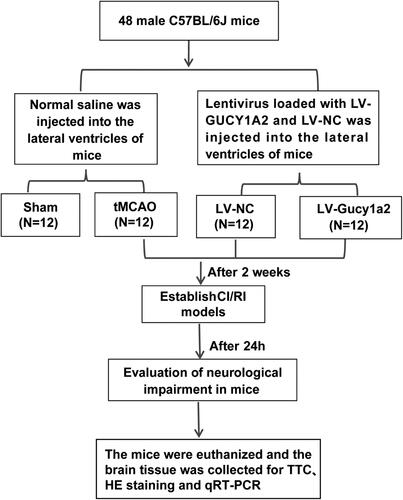
Table 1. RT-qPCR primer sequences.
Figure 2. Circ-gucy1a2 was poorly expressed in brain tissues of CI/RI mice. tMCAO was performed to establish the CI/RI mouse model. A: Neurobehavioral score was used to detect neurological impairment in mice, N = 12; B: TTC staining was used to observe the volume of cerebral infarction in CI/RI mice induced by tMCAO (marked by the yellow line), N = 4; C: HE staining was used to detect the pathological changes of mouse brain tissue, N = 4; D: RT-qPCR was used to detect the expression of circ-Gucy1a2 in brain tissues of mice, N = 4. Data were expressed as mean ± standard deviation, and the t test was used for data comparison between the two groups. ** P < 0.01.
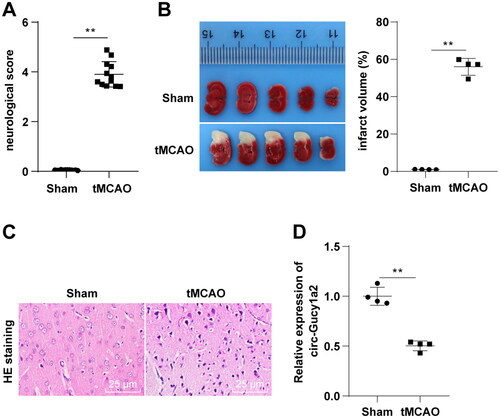
Figure 3. Overexpression of circ-Gucy1a2 reduced cerebral infarction volume in CI/RI mice. The LV-Gucy1a2 lentiviral vector and LV-NC lentiviral vector were injected into the lateral ventricles of mice to overexpress circ-Gucy1a2. Two weeks later, CI/RI mouse models were established. A: The expression of circ-Gucy1a2 was detected by RT-qPCR, N = 4; B: Neurobehavioral score was used to detect neurological impairment in mice, N = 12; C: TTC staining was used to observe the volume of cerebral infarction in CI/RI mice induced by tMCAO, N = 4; D: HE staining was used to detect the pathological changes of mouse brain tissue, N = 4. One-way ANOVA was used for data comparison among groups and Tukey’s test was used for the post hoc test. * P < 0.05, ** P < 0.01.
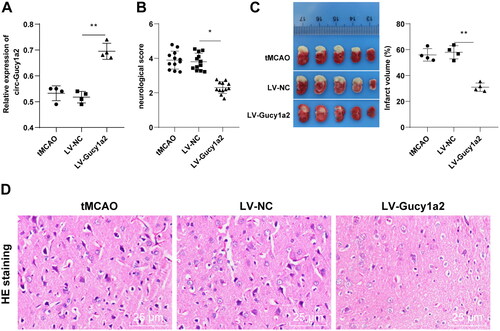
Figure 4. Overexpression of circ-Gucy1a2 reduced neuronal apoptosis induced by OGD/R. The pcDNA3.1-NC and pcDNA3.1-Gucy1a2 were transfected into cells, and the OGD/R model was established 48 hours after transfection. A: RT-qPCR was used to detect the expression of circ-Gucy1a2 in brain tissue. B: The proliferation ability of neurons was detected by CCK-8 assay; C and D: Apoptosis rate was detected by flow cytometry with Annexin V/PI staining and JC-1 staining. One-way ANOVA was used for data comparison among groups and Tukey’s test was used for the post hoc test. * P < 0.05, ** P < 0.01.
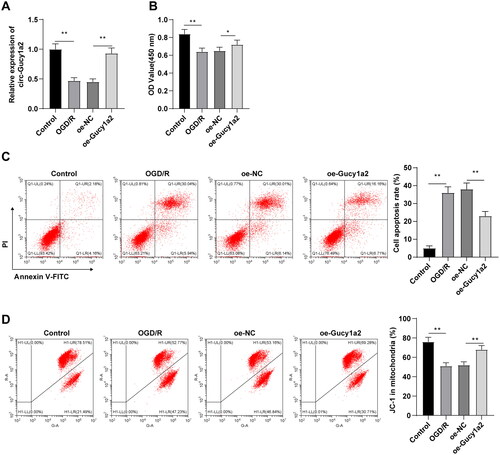
Figure 5. Overexpression of circ-Gucy1a2 reduced the loss of MMP in neurons induced by OGD/R. A: MMP loss was detected by JC-1 staining. Red fluorescence indicates normal MMP, while green fluorescence indicates damaged mitochondria. B: Quantitative analysis of the ratio of green fluorescence intensity to red fluorescence intensity. One-way ANOVA was used for data comparison among groups and Tukey’s test was used for the post hoc test. * P < 0.05, ** P < 0.01.
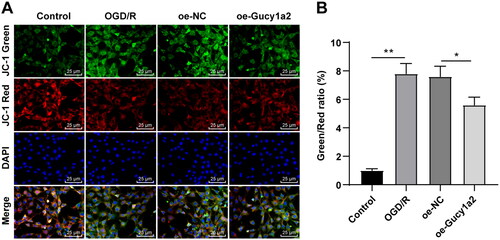
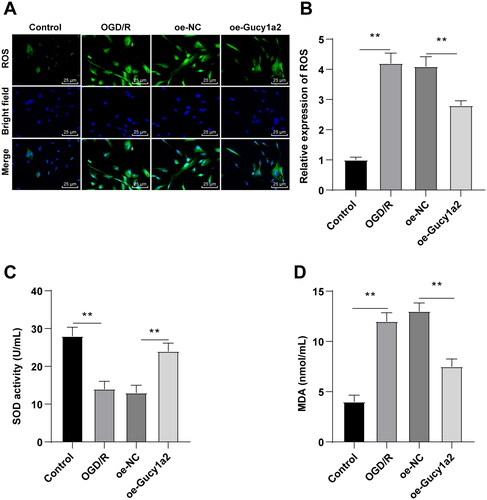
Figure 6. Overexpression of circ-Gucy1a2 reduced the increase of OS in neurons induced by OGD/R. A: ROS levels in neurons were detected by H2DFFDA staining; B: Quantitative analysis of ROS levels; C: The histogram shows SOD activity; D: The histogram shows MDA concentration. One-way ANOVA was used for data comparison among groups and Tukey’s test was used for the post hoc test. ** P < 0.01.
Supplemental Material
Download PDF (71.4 KB)Availability of data and materials
All the data generated or analyzed during this study are included in this published article.