Figures & data
Figure 1. Chemical structure of resveratrol.
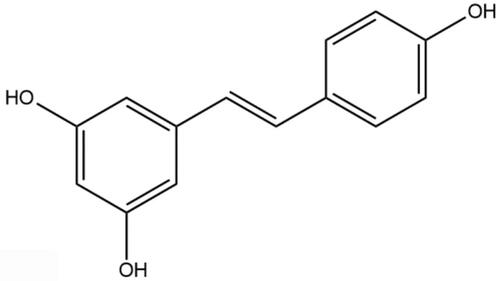
Figure 2. Protective effect of resveratrol on myocardium in septic rats. (A) Experimental process. Drugs were injected intraperitoneally 30 min prior to CLP. (B)-(C) The effect of a range doses of RSV on the serum CK-MB and LDH levels in rats (n = 5 per group). (D) The representative images of H&E staining of myocardium (Kishimoto scores), n = 5 per group. CLP induced blurring or rupture of myocardium concomitant with lymphocytic infiltration and erythrocytic congestion (red arrows), scar bar = 50 μm. Sham: Sham group, CLP: CLP group, L-RSV: CLP + low-dose (10mg/kg) RSV group, M-RSV: CLP + medium-dose (30mg/kg) RSV group, H-RSV: CLP + high-dose (50mg/kg) RSV group, Fer-1: CLP + Fer-1 (5mg/kg) group. Data are expressed as mean ± SD. *p < 0.05 versus Sham. #p < 0.05 versus CLP.
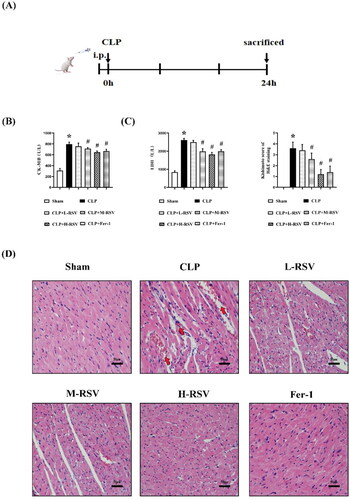
Figure 3. RSV attenuated CLP-induced cardiac dysfunction. (A) The representative M-mode images of echocardiography for each group, n = 4 per group. (B) Statistical analysis of cardiac function indexes LVEF, n = 4 per group. (C) Statistical analysis of cardiac function indexes LVFS. n = 4 per group. (D) Statistical analysis of LVIDd, n = 4 per group. (E) Statistical analysis of LVIDs. n = 4 per group. (F) Statistical analysis of LVEDV, n = 4 per group. (G) Statistical analysis of LVESV, n = 4 per group.
Data are expressed as mean ± SD. *p < 0.05 versus Sham. #p < 0.05 versus CLP. &p < 0.05 versus CLP + H-RSV.
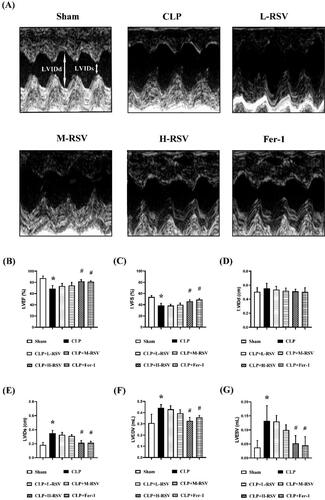
Figure 4. Effect of resveratrol on mitochondria and ferroptosis in the myocardium of septic rats. (A) The representative transmission electron microscopic images of heart at 24 hours after CLP (Flameng scores), scar bar = 2 μm, n = 5 per group. The morphological features of ferroptosis appear as shrunken mitochondria with increased membrane density or outer membrane rupture (red arrows). (B)–(C) Relative protein levels of GPX4 and ACSL4, n = 3 per group. (D) The concentrations of iron in the myocardium tissues, n = 5 per group. (E) The concentrations of MDA in the myocardium tissues, n = 5 per group. Data are expressed as mean ± SD. *p < 0.05 versus Sham. #p < 0.05 versus CLP.
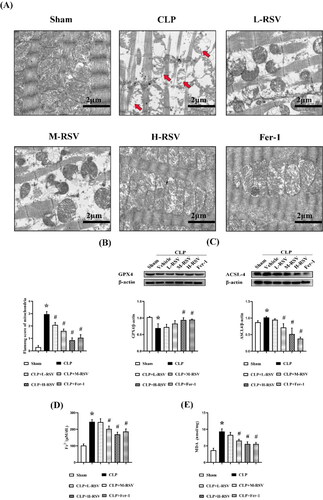
Figure 5. Effect of resveratrol on oxidative stress and mitochondrial function in H9c2 cells. (A) Viability of H9c2 cells after LPS stimulation under different concentrations (0, 1, 3, 5, 10 and 20 µg/mL), n = 3 per group. (B) Viability of H9c2 cells after RSV treatment for 24 h (1, 10, 25, 75, and 100 μM), n = 3 per group. (C) ROS in H9c2 cells with 5 µg/mL LPS and 25 µM RSV, n = 3 per group. (D) The changes of MMP were measured by JC-1 probes, n = 3 per group. Data are expressed as mean ± SD. *p < 0.05 versus control. #p < 0.05 versus LPS.
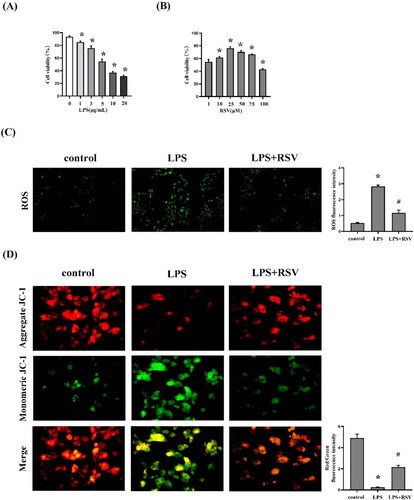
Figure 6. EX527 pretreatment suppressed the cardioprotective effects of RSV and augmented myocardial damage. (A) The representative M-mode images of echocardiography for each group, statistical analysis of cardiac function indexes LVEF and LVFS, n = 4 per group. (B)-(C)the serum CK-MB and LDH levels in rats, n = 4 per group.(D) The representative images of H&E staining of myocardium (Kishimoto scores), n = 4 per group. Sham: Sham group, CLP: CLP group, H-RSV: CLP + high-dose (50mg/kg) RSV group, H-RSV + EX527: CLP + H-RSV + EX527 (5mg/kg) group. Data are expressed as mean ± SD. *p < 0.05 versus Sham. #p < 0.05 versus CLP. &p < 0.05 versus CLP + H-RSV.
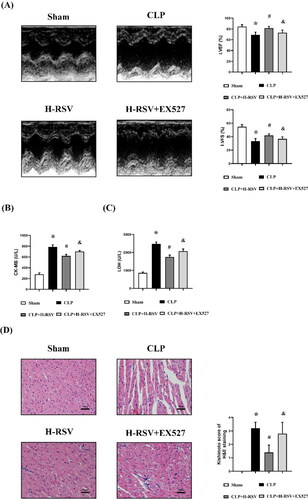
Figure 7. Effect of resveratrol on the activation of Sirt1/Nrf2 signaling pathway in sepsis-induced cardiomyopathy. (A) Molecular docking of RSV to Sirt1. Binding mode between RSV and Sirt1 (Left) and detailed view of SIRT1 (Right). (B)-(C) Relative protein levels of Sirt1 and Nrf2, n = 3 per group. (D) The representative images of immunohistochemical staining using heart tissues with anti-Nrf2, scar bar = 50 μm, n = 5 per group. Data are expressed as mean ± SD. *p < 0.05 versus Sham. #p < 0.05 versus CLP. &p < 0.05 versus CLP + H-RSV.
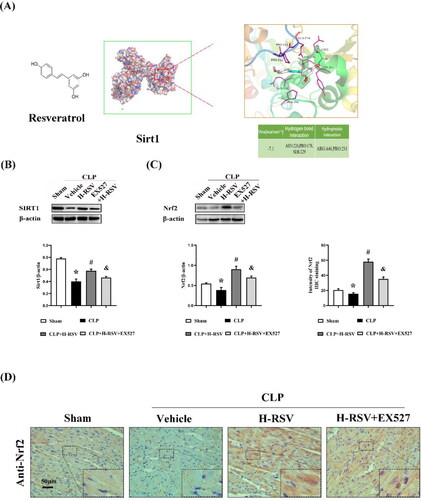
Figure 8. Resveratrol prevents sepsis-induced cardiomyopathy from ferroptosis. (A)Relative protein levels of GPX4, ACSL4, TFR and FTH-1, n = 3 per group.(B) The concentrations of GSH in the myocardium tissues, n = 5 per group. (C) The concentrations of iron in the myocardium tissues, n = 5 per group. (D) The concentrations of MDA in the myocardium tissues, n = 5 per group. (E) The representative images of immunofluorescent staining using heart tissues with anti-4-HNE, scar bar = 25 μm, n = 5 per group. Data are expressed as mean ± SD. *p < 0.05 versus Sham. #p < 0.05 versus CLP. &p < 0.05 versus CLP + H-RSV.
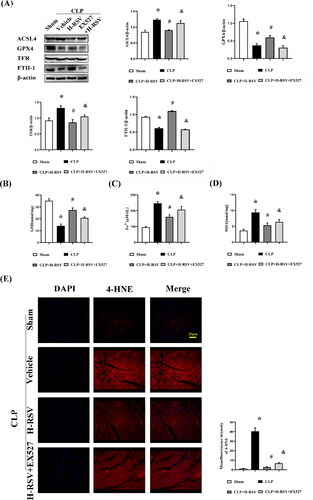
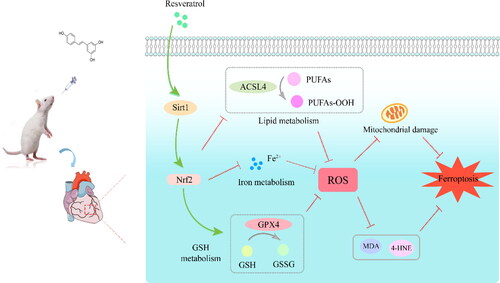
Figure 9. Proposed mechanisms of resveratrol on anti-ferroptosis effects in rats with SIC.