Figures & data
Figure 1. Surgical procedure. A blue arrow points on the humeral head. A + B. Exposure of the proximal humerus. C. The center of the humeral head is burred through the upper part to achieve a round cavity with thin cortices. The blue arrow points on the humeral head. D. The implant (2.7 mm stainless steel barring) is inserted into the cavity.
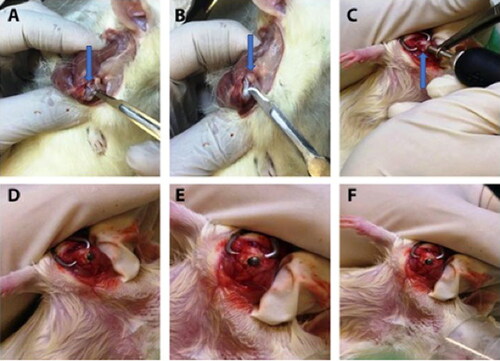
Figure 2. Representative post-operative X-rays. A. Implants are positioned correctly. B. Implant is displaced.
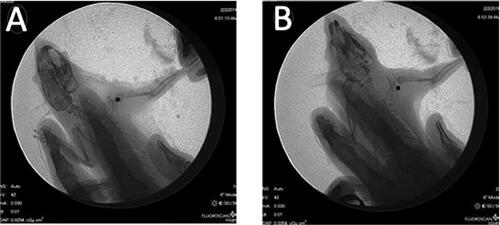
Figure 3. A. Control HE, B. Safranin O—Control, C. Implant HE, D—Safranin O—Implant. (A—Normal cartilage tissue; B—Arrow points on the deep zone of the cartilage tissue; C, D—Severe OA damage, cartilage and subchondral bone destruction.
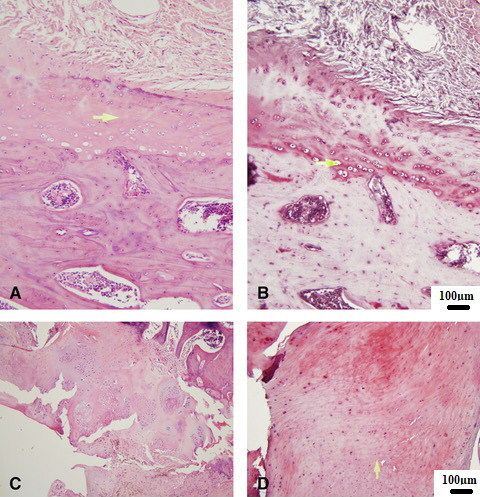
Figure 4. Micro-computed tomography results. Glenoid bone trabecular thickness (Tb.Th, mm) and trabecular spacing (mm) were significantly lower in the implanted group (p<.05). Additionally, bone mineral density (BMD) and tissue mineral density (TMD) were lower (not significantly—p=.07) in the implanted shoulders as compared to the control group. There were no significant differences in bone volume and BV/TV Graphs show mean ± SD. *P<.05.
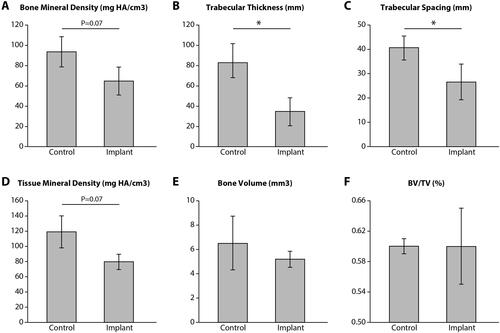
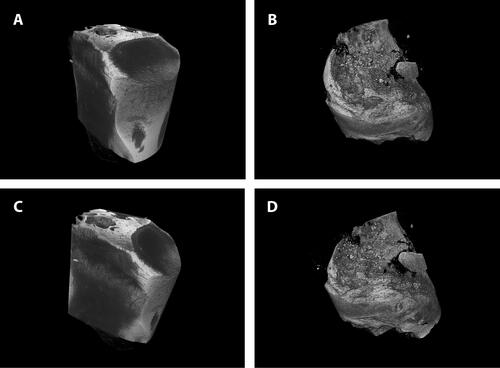
Figure 5. Representative micro–computed tomography specimens for matched control and implant groups (A—Control; B—Implant; C—Control; and D—Implant). Scale bar = 1 mm.