Figures & data
Figure 1. Curcumin can alleviate hepatic IRI and reduce neutrophil infiltration. (A) Serum contents of AST/ALT in controls (I/R) and Cur groups, **P < 0.01, ****P < 0.0001 versus Cur groups, respectively. (B and C) Typical histologic H&E dyeing photos showing necrosis regions in livers from controls and Cur mice exposed to sham or ischemia challenge before reperfusion for diverse durations (magnification, ×100; scale bar, 100 μm; n = 5). (D) Immunohistochemical staining showing Ly6G localization in livers from control groups and Cur treatment groups (magnification, ×200; scale bar, 100 μm) after hepatic I/R for diverse durations. (E) Hepatic apoptosis detected by TUNEL within control groups and Cur treatment groups after hepatic I/R for diverse durations (magnification, ×200; scale bar, 100 μm; n = 5). (F) Number of TUNEL + cells per high power field (HPF, n = 3). (G and H) The expressing levels of proteins of cleaved caspase-3, cleaved PARP, Bcl-2, and Bax were identified via WB in different groups. The statistic diversities amongst groups were evaluated via one-way ANOVA. Data are displayed as the average ± SD. *P < 0.05, **P < 0.01, ***P < 0.001, ****P < 0.0001.
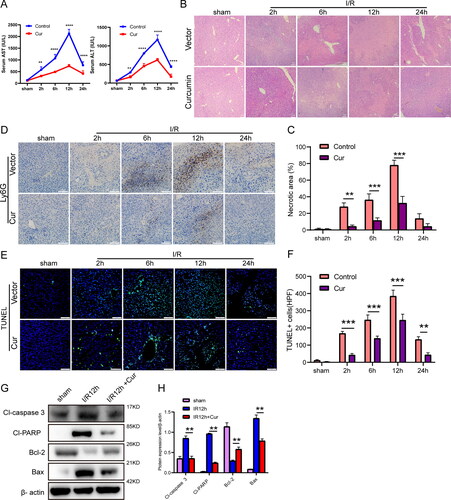
Figure 2. Neutrophil extracellular traps are formed in vivo after liver IRI. (A) According to the evaluation of serum MPO-DNA complex contents, the contents of NETs formed posterior to 1 h ischemic treatment followed by 2 h, 6 h, 12 h, and 24 h of reperfusion. Outcomes are displayed as the comparative fold elevation of MPO-DNA complexes versus sham; average ± SD (n = 6). (B and C) Cit-histone H3 protein contents were identified via WB at different reperfusion time points (D) Typical photos of immunofluorescent dyeing of hepatic samples (initial amplification ×400; scale bars, 50 μm). The existence of Cit-H3 (green), MPO (red), and DAPI (blue) is shown. Data are displayed as the average ± SD (n = 3-6). *P < 0.05, **P < 0.01, ***P < 0.001, ****P < 0.0001 vs sham.
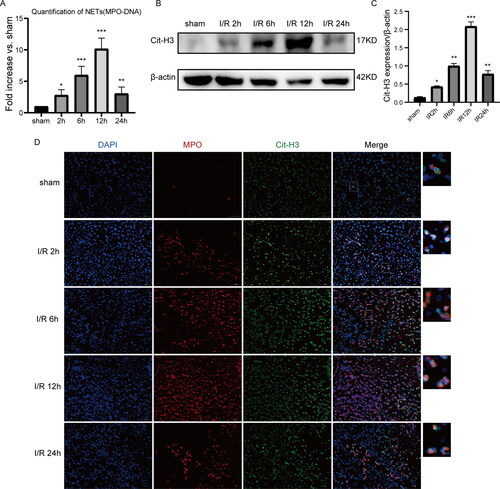
Figure 3. Curcumin inhibits NETs formation in vitro and vivo. (A) Neutrophils obtained from mice were cultured in DMEM medium containing different concentrations of curcumin (20 μM, 40 μM, 80 μM, 160 μM) for 1 h, and then stimulated with 80 nM PMA for 60 min. An upright fluorescent microscope was used to view the NETs’ structural details (magnification, ×200). (B) Quantitative analysis of the percentage of neutrophils NETosis under different conditions. (C) Quantitative analysis of the extracellular DNA/NETs levels. (D) The separated neutrophils from mice were cultured in DMEM medium with curcumin (80 μM) for different time(30 min, 60min, 90min and 120 min), and then stimulated with 80 nM PMA for 60 min. (E) Quantitative evaluation of the percentage of neutrophils experiencing NETosis under various circumstances. (F) Quantitative evaluation of the percentage of neutrophils NETosis under different conditions. (G and H) Detection of Cit-H3 expression by western blot under different conditions. (I) Serum MPO-DNA was measured by ELISA. The statistic diversities amongst groups were evaluated via one-way ANOVA. Data are displayed as the average ± SD. *P < 0.05, **P < 0.01, ***P < 0.001, ****P < 0.0001.
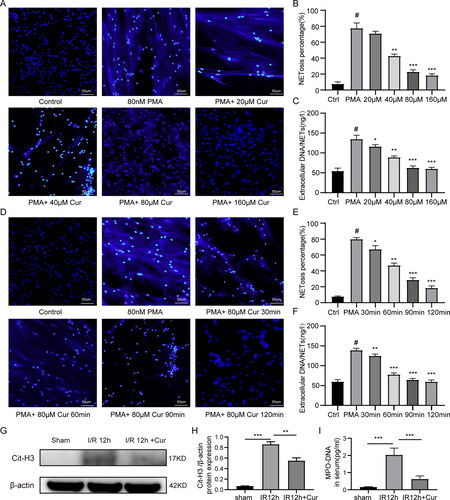
Figure 4. Curcumin inhibits NETs formation and alleviates hepatic IRI by inhibiting MEK/ERK pathway. (A) From mice in various treatment groups, neutrophils were extracted and cultivated for two hours in the absence of stimulation. PMA (80 nM) stimulated group was used as the positive control group. An upright fluorescent microscope was used to view the NETs’ structural details (magnification,×200). (B) Quantitative evaluation of the percentage of neutrophils experiencing NETosis under various circumstances. (C) Dual immunofluorescent assay of MPO (red) and Cit-H3 (green) in liver issues (initial amplification ×400; scale bars, 50 μm). (D and E) Quantitative analysis of MPO and Cit-H3 positive area. (F–H) The expressing levels of proteins of Cit-H3, p-Mek1/2, Mek1/2, p-Erk1/2, and Erk1/2 were identified via WB. Data are displayed as the average ± SD (n = 3-6). *P < 0.05, **P < 0.01, ***P < 0.001, ****P < 0.0001.
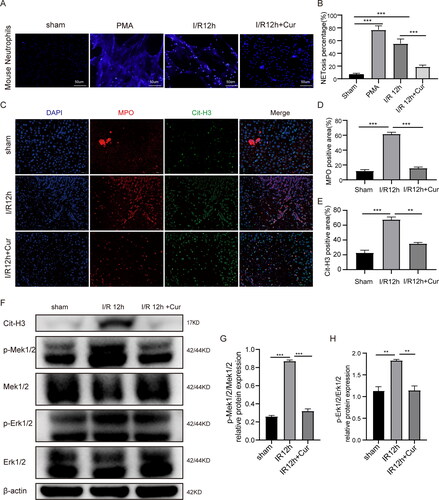
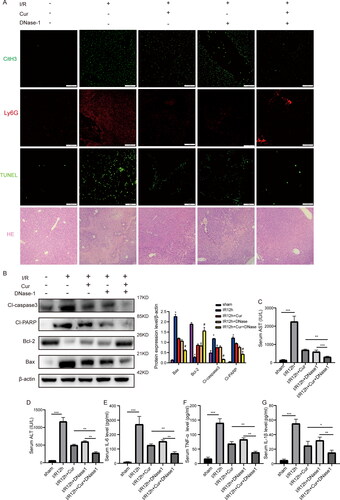
Figure 5. Curcumin and DNase-1 have synergistic effects on reducing hepatic IRI. (A) Effects of Curcumin and DNase-1 on neutrophil infiltration, NETs formation, hepatocyte apoptosis and histopathological changes in liver tissue with liver IRI (amplification, ×200; scale bar, 100 μm) (n = 5). (B) WB assay of the expressing levels of proteins of cleaved caspase-3, cleaved PARP, Bcl-2, and Bax in hepatic IRI with curcumin and DNase-1 administration. (C-G) The expressing levels of AST, ALT, TNF-α, IL-6, and IL-1β were identified via an ELISA tool (n = 5). *P < 0.05, **P < 0.01, ***P < 0.001, ****P < 0.0001.