Figures & data
Table 1. Chiu histological scoring.
Figure 1. After intestinal I/R of astaxanthin, (A) CAT, (B) SOD, (C) MDA, (D) Caspase-3, (E) IL-1, (F) IL-6, (G) P53 and (H) Effect on TNFα values (All groups were compared with the I/R group and shown as p < 0.001 ★★★, p < 0.01 ★★, p < 0.05 ★).
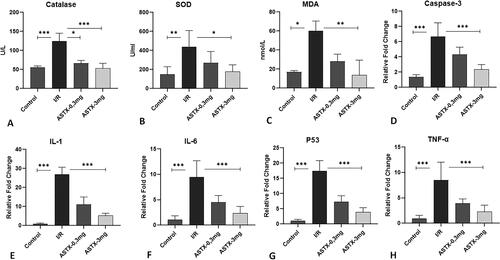
Figure 2. Histological appearance and statistical graph of intestinal tissue as a result of hematoxylin-eosin staining (A. Control group, B. I/R group, C. 0.3 mg Astaxanthin group, D. 3 mg Astaxanthin group) (All groups were compared with I/R group and Displayed as p < 0.0001 ★★★★.).
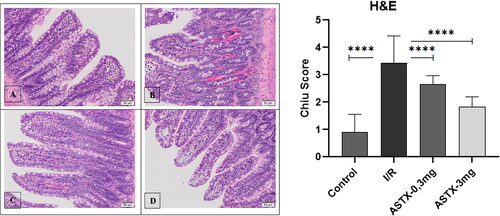
Figure 3. Histological appearance and statistical graph of Caspase-3 immunoreactivity of intestinal tissue (A. Control group, B. I/R group, C. 0.3 mg Astaxanthin group, D. 3 mg Astaxanthin group) (All groups were compared with I/R group and Displayed as p < 0.0001 ★★★★.).
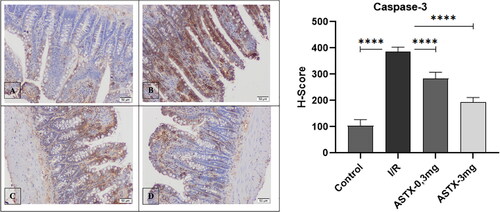
Figure 4. Histological appearance of intestinal tissue as a result of PAS staining (A. Control group, B. I/R group, C. 0.3 mg Astaxanthin group, D. 3 mg Astaxanthin group).
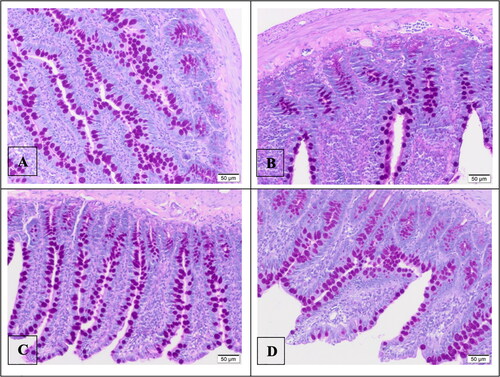
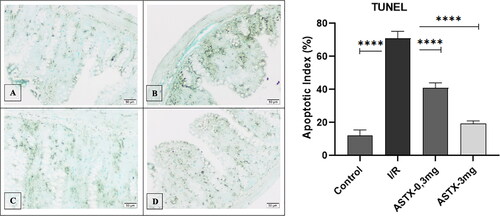
Figure 5. Histological appearance and statistical graph of intestinal tissue as a result of TUNEL staining (A. Control group, B. I/R group, C. 0.3 mg Astaxanthin group, D. 3 mg Astaxanthin group) (All groups were compared with I/R group and Displayed as p < 0.0001 ★★★★.).