
Figures & data
Figure 1. SRY-box transcription factor 9 (SOX9) expression levels are decreased in glucocorticoid (GC)-induced human bone marrow stromal cells (hBMSCs). (A–C) RUNX family transcription factor 2 (RUNX2), alkaline phosphatase (ALP), and osterix expression levels were determined in untreated and GC-induced hBMSCs via reverse transcription-quantitative polymerase chain reaction (RT-qPCR) analysis. (D) ALP detection kit was used to measure the ALP activity. (E and F) RT-qPCR and western blotting analysis of SOX9 expression. **p < 0.01 vs. control group.
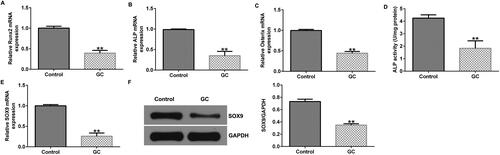
Figure 2. SOX9-plasmid improves the osteogenic differentiation of hBMSCs. (A and B) hBMSCs were transfected with the control-plasmid and SOX9-plasmid in the presence of 1600 mg GCs for 48 h, followed by RT-qPCR and western blotting analysis to measure the SOX9 expression levels. (C and D) hBMSCs were divided into four groups: control, GC, GC + control-plasmid, and GC + SOX9-plasmid groups. SOX9 expression levels were determined via RT-qPCR and western blotting. (E–G) RT-qPCR analysis of RUNX2, ALP, and osterix expression levels. (H) ALP activity was examined using a specific kit. **p < 0.01 vs. control-plasmid; ##p < 0.01 vs. control; &&p < 0.01 vs. GC + control-plasmid.
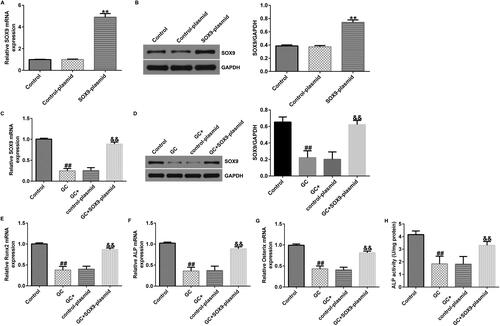
Figure 3. Upregulation of SOX9 expression promotes the viability of hBMSCs. (A) 3-(4,5-dimethylthiazol-2-yl)-2,5-diphenyltetrazolium bromide (MTT) assay was performed to examine cell proliferation in different groups: control, GC, GC + control-plasmid, and GC + SOX9-plasmid groups. (B and C) Flow cytometry (FCM) assay was performed to examine cell apoptosis. **p < 0.01 vs. control; ##p < 0.01 vs. GC + control-plasmid.
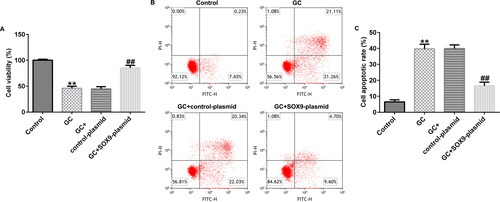
Figure 4. SOX9-small interfering RNA (siRNA) suppresses the osteogenic differentiation of hBMSCs. (A and B) hBMSCs were transfected with the control-plasmid and SOX9-plasmid in the presence of 1600 mg GCs for 48 h, followed by RT-qPCR and western blotting analysis to determine the transfection efficiency of SOX9-siRNA and expression levels of SOX9. (C and D) SOX9 expression levels were determined via RT-qPCR and western blotting assay in four groups: control, GC, GC + control-siRNA, and GC + SOX9-siRNA groups. (E–G) RT-qPCR analysis of RUNX2, ALP, and osterix expression levels. (H) ALP activity was examined using a specific kit. **p < 0.01 vs. control-siRNA; ##p < 0.01 vs. control; &, &&p < 0.05, 0.01 vs. GC + control-siRNA.
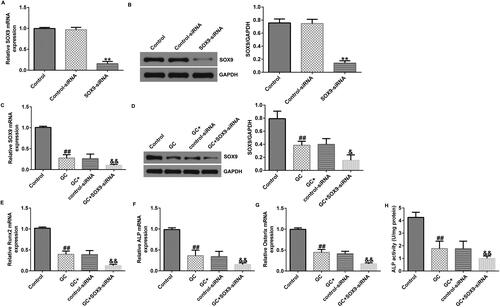
Figure 5. SOX9 knockdown inhibits hBMSC proliferation and promotes their apoptosis. (A) MTT assay was used to determine the cell viability in different groups: control, GC, GC + control-siRNA, and GC + SOX9-siRNA groups. (B and C) FCM assay was used to examine the cell apoptosis. **p < 0.01 vs. control; ##p < 0.01 vs. GC + control-siRNA.
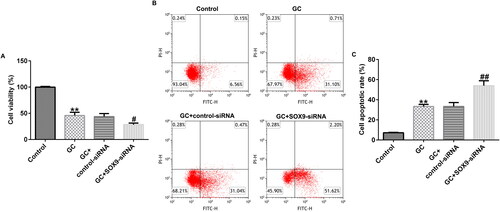
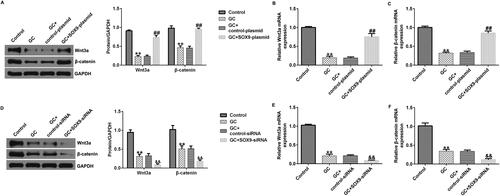
Figure 6. Role of SOX9 is associated with the Wnt/beta-catenin pathway in the osteonecrosis of the femoral head (ONFH) in vitro model. (A and D) Western blotting analysis of Wnt3a and β-catenin expression levels. (B and E) RT-qPCR analysis of Wnt3a expression levels. (C and F) RT-qPCR analysis of β-catenin expression levels. **p < 0.01 vs. control; ##p < 0.01 vs. GC + control-plasmid; &&p < 0.01 vs. GC + control-siRNA.
Data availability statement
The datasets used and/or analyzed during the current study are available from the corresponding author on reasonable request.