Figures & data
Table 1. Primer sequences in RT-qPCR.
Figure 1. Bioinformatics analysis of key genes in HCCA. (A) Volcano map of DEGs in GSE34166 dataset; (B) Volcano map of DEGs in GSE68292 dataset; (C) Venn diagram of DEGs in both datasets, with red representing upregulated genes and blue downregulated genes; (D) High expression level of miR-25-3p in HCCA analyzed by Starbase.
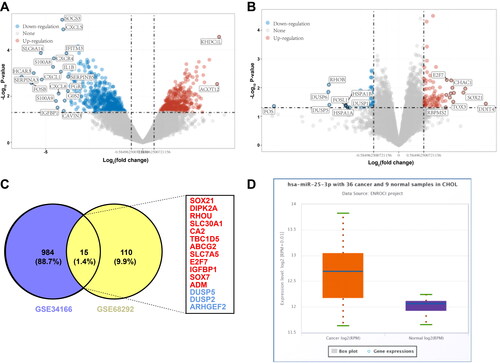
Figure 2. miR-25-3p targets DUSP5 in HCCA. (A) The binding site of DUSP5 and miR-25-3p predicted on Starbase database; (B) Interaction between DUSP5 and miR-25-3p analyzed by dual-luciferase reporter gene assay; (C) The levels of miR-25-3p and DUSP5 RNA measured by RT-qPCR; (D) DUSP5 protein level determined by Western blot; (E) miR-25-3p and DUSP5 RNA expression levels measured by RT-qPCR; (F) DUSP5 protein level after transfection determined by Western blot. Cell experiment was repeated 3 times. Data were mean ± standard deviation. Pairwise comparisons in figures B-D were made using independent sample t test, and comparisons in figures E/F were made using one-way ANOVA, followed by Tukey’s test. *p<0.05, **p < 0.01.
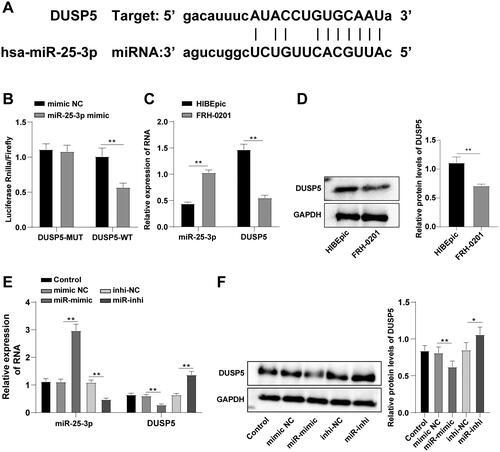
Figure 3. miR-25-3p potentiates HCCA cell proliferation and migration by targeting DUSP5. (A) Cell apoptosis assessed by TUNEL staining; (B) Cell proliferation assessed by CCK-8 assay; (C) Cell migration assessed by scratch healing assay; (D) Cell invasion assessed by Transwell assay. Cell experiment was repeated 3 times. Data were mean ± standard deviation. Comparisons among groups were made using one-way ANOVA, followed by Tukey’s test. **p < 0.01.
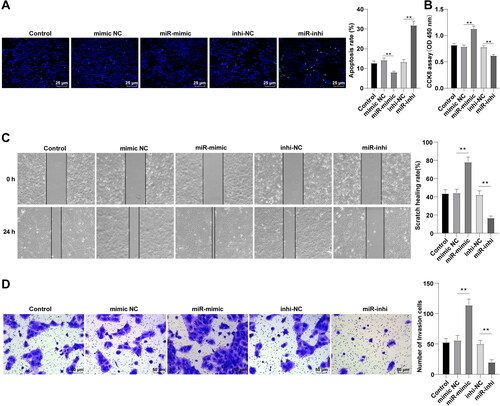
Figure 4. DUSP5 overexpression partially negates miR-25-3p-mediated promotional effect on HCCA cell proliferation and migration. (A) DUSP5 protein level measured by Western blot; (B) Cell apoptosis assessed by TUNEL staining; (C) Cell proliferation assessed by CCK-8 assay; (D) Cell migration assessed by scratch healing assay; (E) Cell invasion assessed by Transwell assay. Cell experiment was repeated 3 times. Data were mean ± standard deviation. Comparisons among groups were made using one-way ANOVA, followed by Tukey’s test. *p<0.05, **p < 0.01.
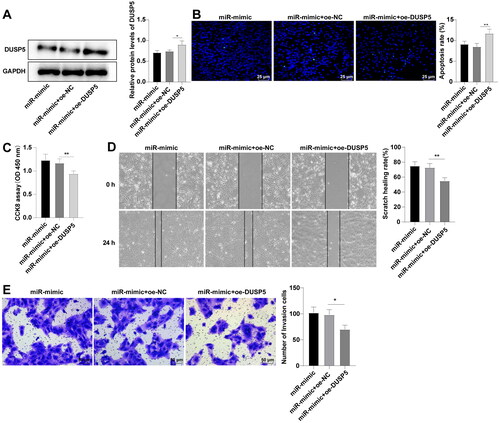
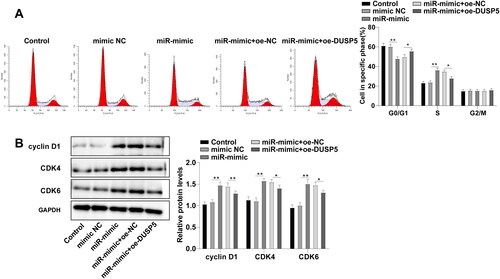
Figure 5. miR-25-3p facilitates G1/S phase transition of HCCA cells by targeting DUSP5. (A) Cell cycle assessed by flow cytometry; (B) Levels of cell cycle-associated proteins determined by Western blot. Cell experiment was repeated 3 times. Data were mean ± standard deviation. Comparisons were analyzed using one-way ANOVA, followed by Tukey’s test. *p<0.05, **p < 0.01.