
Figures & data
Table 1. Primer sequences.
Figure 1. CAL alleviates LPS-induced ALI by upregulating miR-375-3p. (A) lung tissues stained by HE and histopathological scores estimated according to the severity of lung injury; (B) cell apoptosis assessed by TUNEL staining; (C) pulmonary edema assessed by W/D ratio; (D) number of inflammatory cells (macrophages, lymphocytes, and neutrophils) in BALF counted using a blood cell counter; (E) levels of TNF-α, IL-1β, IL-4 and IL-10 in BALF determined by ELISA; (F) miR-375-3p expression measured by RT-qPCR. N = 6. Data are shown as mean ± standard deviation. Data among groups were compared using a one-way analysis of variance, followed by Turkey’s test. nsp > 0.05, *p < 0.05, **p < 0.01, ***p < 0.001.
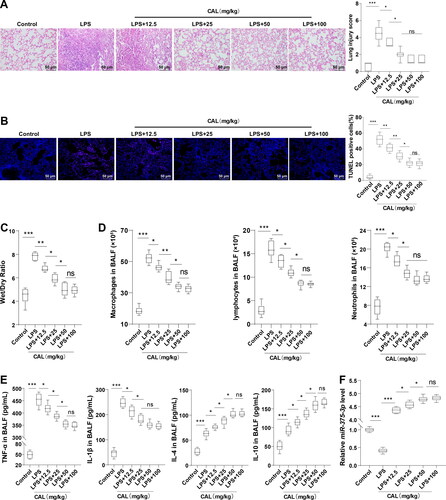
Figure 2. CAL extenuates LPS-evoked MLE-12 cell injury by upregulating miR-375-3p. (A) the best dose level of CAL determined by MTT; (B) cell viability assessed by MTT; (C) cell apoptosis assessed by flow cytometry; (D) levels of TNF-α, IL-1β, IL-4, and IL-10 in MLE-12 cells determined by ELISA; (E) miR-375-3p expression measured by RT-qPCR. Data are shown as mean ± standard deviation. Cell experiments were repeated 3 times. Data among groups were compared using a one-way analysis of variance, followed by Turkey’s test. **p < 0.01, ***p < 0.001.
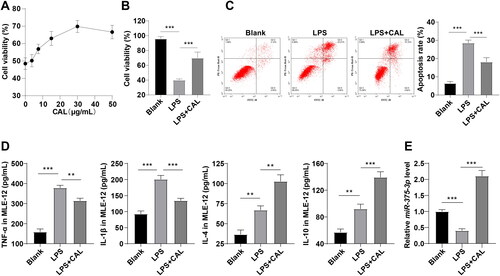
Figure 3. Inhibition of miR-375-3p partially negates CAL-mediated inhibition on LPS-induced MLE-12 cell injury. (A) miR-375-3p transfection efficiency confirmed by RT-qPCR; (B) cell viability assessed by MTT; (C) cell apoptosis assessed by flow cytometry; (D) levels of TNF-α, IL-1β, IL-4, and IL-10 in MLE-12 cells determined by ELISA. Data are shown as mean ± standard deviation. Cell experiments were repeated 3 times. Data among groups were compared using a one-way analysis of variance, followed by Turkey’s test. **p < 0.01, ***p < 0.001.
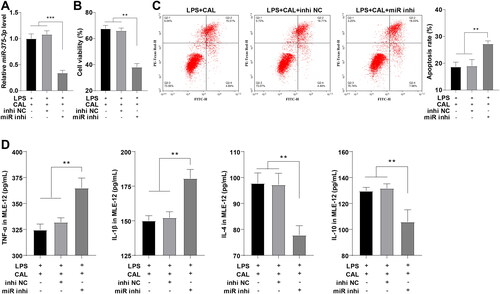
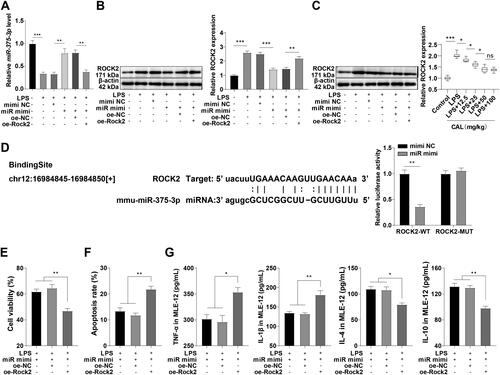
Figure 4. miR-375-3p ameliorates LPS-induced ALI by targeting ROCK2. (A) miR-375-3p transfection efficiency confirmed by RT-qPCR; (B) ROCK2 expression in MLE-12 cells determined by Western blot; (C) ROCK2 expression in lung tissues of mice determined by Western blot; (D) target relationship between miR-375-3p and ROCK2 confirmed by dual-luciferase reporter assay; (E) cell viability assessed by MTT; (F) cell apoptosis assessed by flow cytometry; (G) levels of TNF-α, IL-1β, IL-4, and IL-10 in MLE-12 cells determined by ELISA. Data are shown as mean ± standard deviation. Cell experiments were repeated 3 times. Data in figures (A-C) and (E-G) were analyzed using a one-way analysis of variance, followed by Turkey’s test. Data in Figure (D) were analyzed using t test. *p < 0.05, **p < 0.01, ***p < 0.001.
Supplemental Material
Download TIFF Image (228.6 KB)Data availability statement
The data that support the findings of this study are available from the corresponding author upon reasonable request.