
Figures & data
Figure 1. Schematic of the different rat models. (A) Portal (left) and hepatic (right) vein anatomy of the RML and LML are displayed, the dotted line indicated the boundaries of drainage areas of different HVs. (B) The second hepatic hilum of rat liver. The posterior vena cava, RMHV and common trunk were presented. (C) The MMHV were obstructed with suturing ligation, the needle entry and exit points were shown. (D) Schematics of the R, M, RM and LVD groups are described, respectively.
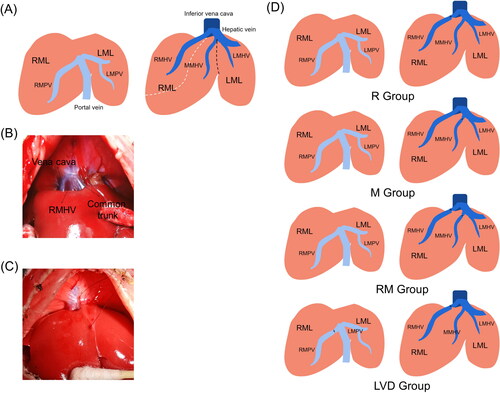
Table 1. Experimental designation.
Figure 2. Liver remodeling after the different surgeries. (A) Changes in the appearance of the live ML after surgery on postoperative days (PODs) 0, 2 and 7. (B) Changes in the body weight at each time point. (C) Weight of the remnant liver/body weight evolution. (D) The LML growth ratio of different groups were shown. (E) The LML/RML shows the morphological changes in the ML after surgery (*, RM vs. Control; #, LVD vs. Control. * or #, P < 0.05; *** or ###, P < 0.001).
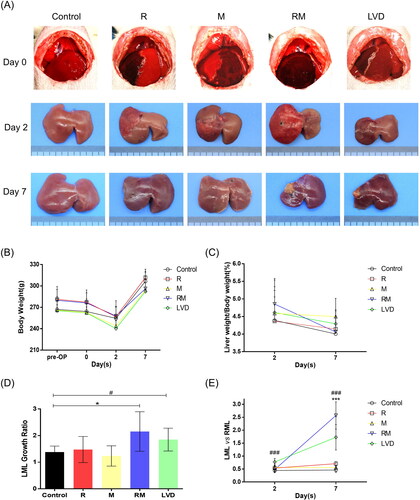
Figure 3. Histologic and immunohistochemical assessment. (A) The LMLs were subjected to a tissue chip analysis. Slides were stained with H-E (upper) and Ki-67 (lower). Quantification of the number of Ki-67-positive cells in the LML after surgery in all of the different groups (DAM were subjected to the histology analysis. The white, red and black arrows indicate the viable hepatocyte islands, necrotic area and fibrous tissues, respectively) (*** or ###, P < 0.001). (B) The RMLs (congestive liver tissues) of the different groups exhibited different changes; thus, the representative images of H&E-staining were presented, respectively. Collagen deposition was detected by Sirius red staining. In the RM and LVD group at POD7, the DAR were necrotic.
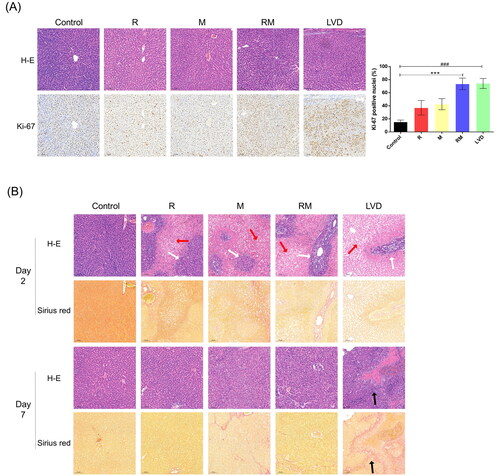
Figure 4. Changes in liver functions after surgery. The liver function and injury were evaluated by the serum levels of AST (A), ALT (B), T-Bil (C), ALB (D), PT (E), and PLT (F). (*, RM vs. Control; #, LVD vs. Control. * or #, P < 0.05; ** or ##, P < 0.01).
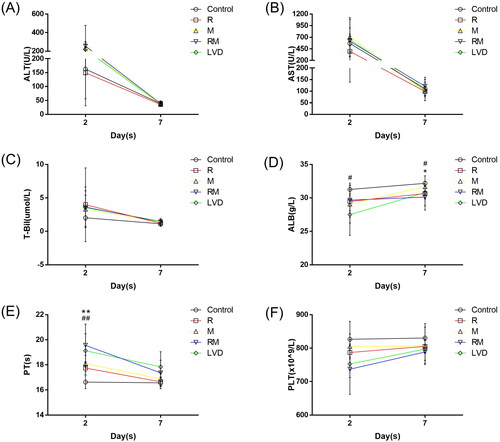
Figure 5. Methylene blue staining and retrograde pressurized perfusion assay. (A) The RMHV, MMHV or both the RMHV and MMHV were obstructed, then injected the methylene blue solution into the center of different DRs. The dyeing area indicated the direction of blood flow. (B) After the occlusion of both the RMHV and MMHV, the methylene blue was retrogradely perfused into the RMHV. These photos presented the liver appearance before (left) and after (right) occlusion of hepatic pedicle, respectively. The hepatic-portal venous reflux was observed and the LLL turned blue (white arrow). After the hepatic pedicle was occluded with vascular forceps and continue to push the methylene blue, part of DAM were dyed with methylene blue (green arrow).
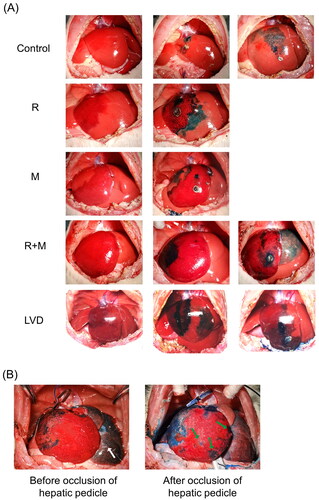
Figure 6. Schematic illustration of intrahepatic venovenous collaterals. There exist several intrahepatic venovenous collaterals between the adjacent hepatic venous drainage areas. This assay indicated the two characteristics of these collateral pathways: 1. Two way opening; 2. Timely opening; 3. Pressure-dependent.
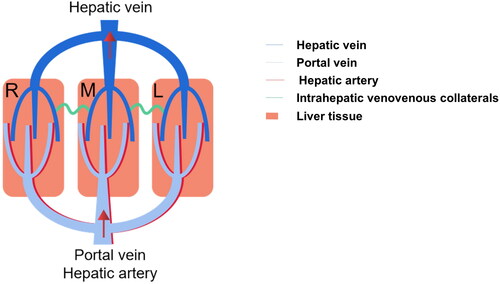
Table 2. Different treatments targeting the liver inflow/outflow pathway can have different effects on the liver.
Supplemental Material
Download PDF (251.2 KB)Data sharing statement
Data and materials are available upon reasonable request to the corresponding author.