
Figures & data
Table 1. Primer sequences.
Figure 1. miR-425-5p was upregulated in PC. (A-B) miR-425-5p expression levels in patient tissues were determined by RT-qPCR. (C) Correlation between miR-425-5p expression in cancer tissues of PC patients and TNM stage was assessed by Spearman correlation analysis. Data were exhibited as mean ± SD and comparisons between two groups were performed using the t-test. **p < 0.01.
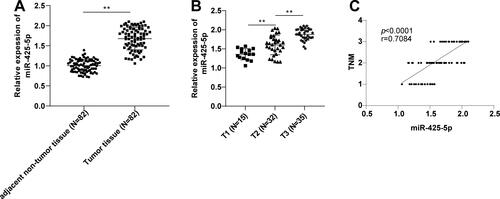
Table 2. Changes of immune cell levels in PC (mean ± SD).
Table 3. Changes of immune factor levels in PC (mean ± SD).
Table 4. Correlation analysis between miR-425-5p and immune microenvironment in PC patients.
Figure 2. Relationship between miR-425-5p and prognosis in PC patients. Survival curves were plotted using the regular follow-up data. Log-rank was used to test differences in Kaplan-Meier curves.
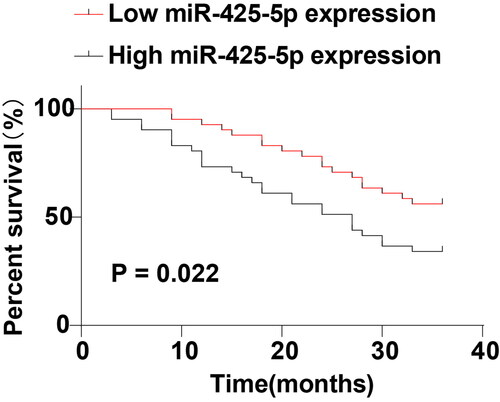
Table 5. Correlation of miR-425-5p expression with clinical characteristics of PC patients.
Table 6. Correlation of miR-425-5p expression with TNM stage.
Data availability statement
The datasets used and analyzed during the current study are available from the corresponding author on reasonable request.