
Figures & data
Figure 1. Diagram of the groups and operations in the standardized mouse abdominal adhesion models explored. (A). Sham group. (B). Brush group. (C). Ischemic button (IB) group. (D). Brush and ischemic button (BIB) group. (E). Clamp group. (F). Electric coagulation (EC) group. (G). Suture group.
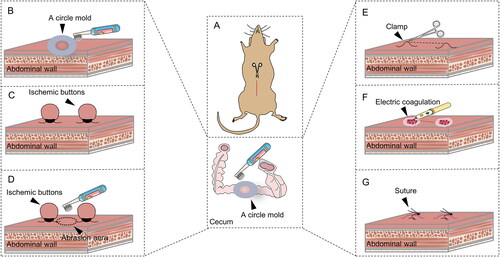
Table 1. Groups and operation details of standardized mouse PAA models.
Figure 2. Highly reproducible induction of abdominal adhesions by brushing of the parietal peritoneum and cecum. (A) Open surgical observation of PAA conditions in each group (n = 10; red arrows mark adhesion tissue). (B–D) Raincloud map showing Nair’s adhesion scores (B), Lauder’s adhesion scores (C) and adhesion percentage (D) of mice in different modeling groups. (Raincloud map: cloud is a violin diagram; umbrella is a boxplot; rain is a scatter diagram; thunder is the line of the average score in each group. As shown in the figure, brushing of the parietal peritoneum and cecum was the most stable method with the best consistency).
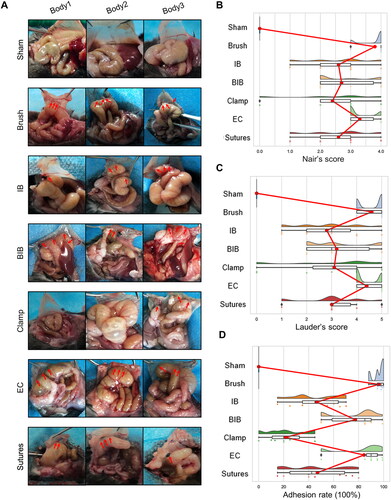
Figure 3. Dynamic visual observation of the process of adhesion evolution by laparoscopy. (A) Open surgical observation of normal peritoneum and PAA conditions on PODs 1, 3, 5, 7 and 14; black arrows mark adhesion tissue (n = 60). (B) Nair’s adhesion scores at different time points under typical gross observation (n = 10; compared with the control group, *P < 0.05). (C) Lauder’s adhesion scores at different time points under typical gross observation (n = 10; compared with the control group, *P < 0.05). (D) Representative images of abdominal adhesion formation in the injured areas visualized by laparoscopy (n = 60, yellow arrows indicate subserosal hemorrhage on the injured cecal surface, and red arrows indicate tight flaky adhesion of the cecum to the abdominal wall). (E) Nair’s adhesion scores at different time points under laparoscopy (n = 10; compared with the control group, *P < 0.05, ***P<0.001). (F) Lauder’s adhesion scores at different time points under laparoscopy (n = 10; compared with the control group, *P < 0.05, ***P<0.001).
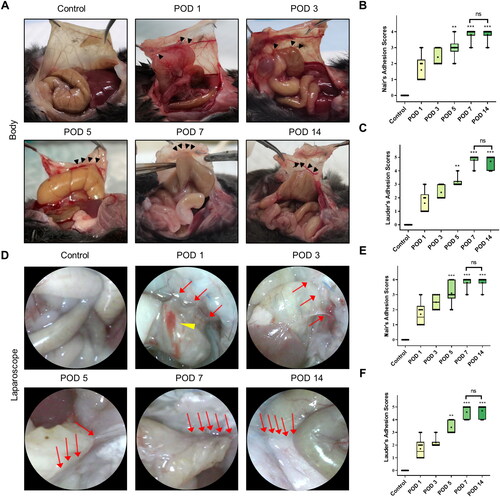
Figure 4. Dynamic visual observation of the process of adhesion evolution by artificial pneumoperitoneum CT. (A) CT images of adhesions in the abdominal cavity at different time points. The yellow five-pointed stars indicate the gas-filled intestine, and the red dotted line indicates the longest diameter of the adhesion between the cecum and the parietal peritoneum (n = 60). The intra-abdominal organs were evenly distributed, and an obvious semicircular gas-density gap was clearly displayed between the cecum and the abdominal wall, indicating a clear separation and lack of adhesion bands between the cecum and the abdominal wall. (B) Three-dimensional reconstruction of PAAs in mice on PODs 5, 7 and 14 (sagittal view; red dotted line indicates the longest diameter of the adhesion between the cecum and the parietal peritoneum).
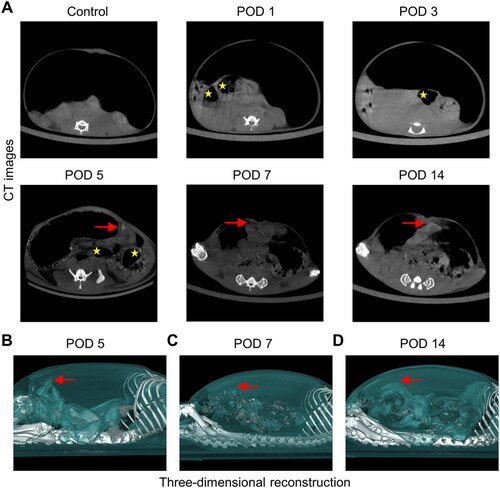
Table 2. Different examination methods for visualizing PAA formation and the scope of application.
Figure 5. Degree of inflammation and collagen deposition in injured peritoneum and adhesion. (A) Histological observation of peritoneal tissues at different time points (100×; inset, 400×). (B) Representative images showing picrosirius red staining (100×; inset, 400×). (C) Inflammatory scores at different time points based on histology (n = 10; compared with the control group, *P < 0.05, ***P<0.001). (D) Thickness of the collagen fiber zone in the adhesion tissue (n = 10; compared with the control group, *P < 0.05, ***P<0.001).
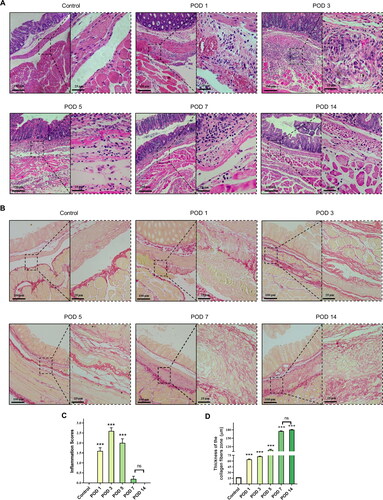
Figure 6. Representative images of the mesothelial cell layer and apoptosis in the peritoneal tissue and adhesions visualized by immunofluorescence staining (40×). The yellow lines indicate mesothelial cells, and adhesions (ADH) are indicated by gray boxes (mesothelial cells are characterized by the expression of cytokeratin 19 (CK 19)).
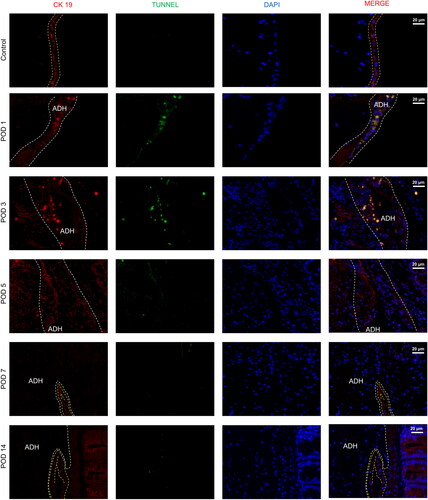
Table 3. Histological characteristics at different stages of PAA formation.
Figure 7. RNA-seq analysis of adhesion tissues at different time points. (A–C) Volcano plot of overall gene-based differential expression results for adhesion tissues on PODs 1 (A), 3 (B) and 7 (C) vs. normal peritoneal-cecal tissues (each dot corresponds to a gene). The y-axis corresponds to the negative log (base 10) of the P values, while the x-axis corresponds to the negative log (base 2) of the fold change for the difference in expression in adhesion tissues at different time points. Adjusted p value<0.01 (red dots and green dots). POD 1 showed 1,037 upregulated genes and 590 downregulated genes. POD 3 showed 1535 upregulated genes and 969 upregulated genes. POD 7 showed 866 upregulated and 325 downregulated genes. (D) Heatmap representing the top 50 DEGs among normal peritoneal-cecal tissues and adhesion tissues on PODs 1, 3 and 7. FDR <0.05. Red indicates upregulation, and green indicates downregulation. (E–G) KEGG pathway enrichment analysis of DEGs in adhesion tissues on PODs 1 (E), 3 (F) and 7 (G). The size of the circle represents the significance of enrichment.
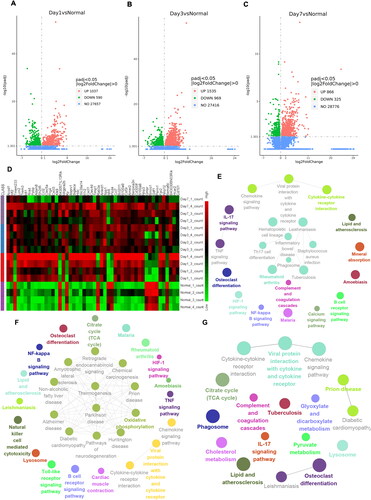
Figure 8. Identification and functional analysis of 10 hub genes. (A–C) The top 10 hub genes in the PPIN of adhesion tissues on PODs 1 (A), 3 (B) and POD 7 (C) were screened by the Cytoscape plugin cytoHubba based on the degree of connection. Functions and pathways of the hub genes were visualized using ClueGO.
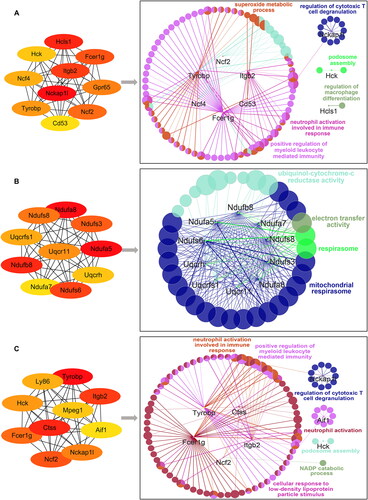
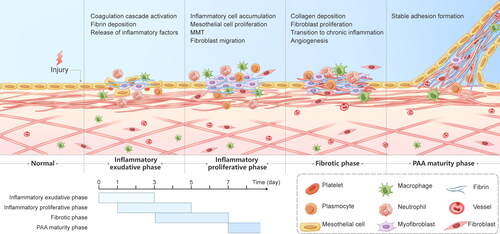
Figure 9. Graphical description of the progression of PAAs. PAA formation mainly consists of the inflammatory exudative phase, the inflammatory proliferative phase, the fibrotic phase and the PAA maturity phase, with overlap between the first three phases. The inflammatory exudative phase lasts 3 days from the beginning of the surgery and is dominated by early activation of the coagulation cascade, massive release of inflammatory factors and fibrin deposition. The inflammatory proliferative phase is mainly present on PODs 1-5 and is characterized by inflammatory cell aggregation, fibroblast migration, and the MMT. The fibrotic phase lasts from POD 3 to POD 7 and consists mainly of fibroblast growth into the deposited collagen, angiogenesis and the transition from acute to chronic inflammation, culminating in the formation of stable adhesions.
Supplemental Material
Download PDF (510.2 KB)Data availability statement
The data supporting the findings of this study are available from the corresponding author upon request.