
Figures & data
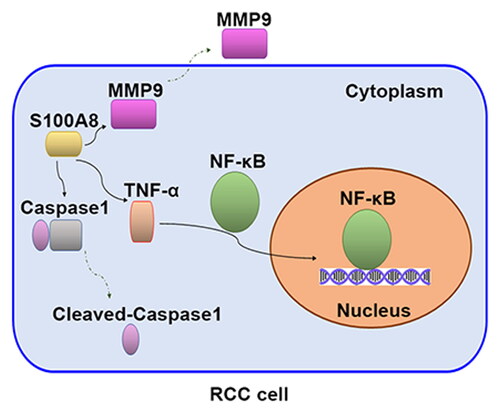
Table 1. The nucleotide sequences of PCR primers.
Figure 1. Transcriptome profiling between RCC tumor tissues and corresponding adjacent normal tissues (GSE100666). DEGs were shown in the heatmaps (A). Top 10 GO analyses terms of BP, CC, and MF (B). GO analyses terms of BP that associated with cell growth, apoptosis, and inflammation (C). TOP 20 KEGG pathway enrichment analyses of DEGs (D).
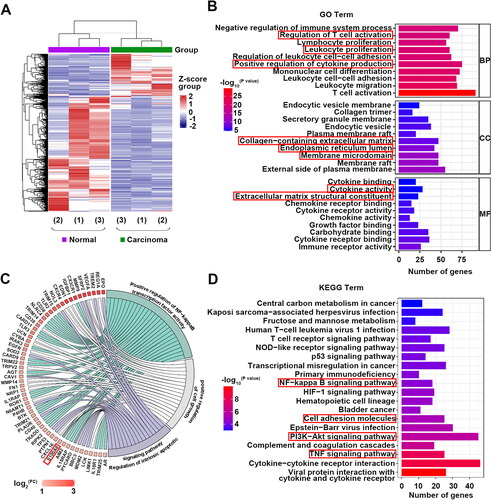
Figure 2. Protein expression of S100A8 in the renal tissues of RCC patients. Immunohistochemical (A) and western blotting (B) analysis of S100A8 expression in the renal tissues from patients with RCC.
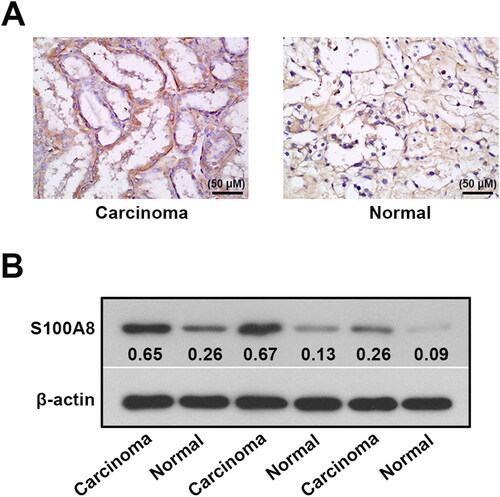
Figure 3. S100A8 knockdown inhibited proliferation and promoted apoptosis in RCC cells. MTT was used to detect cell proliferation in 786-O cells (A) and ACHN cells (B) with S100A8 silencing. Flow cytometry apoptosis analysis of 786-O cells (C) and ACHN cells (D).
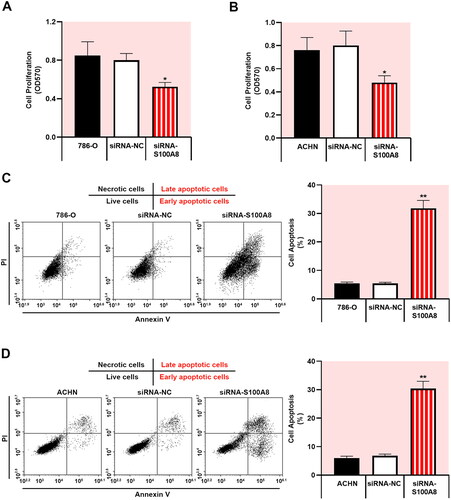
Figure 4. Downregulation of S100A8 suppressed the NF-κB signaling pathway. Real-time PCR was performed to access the mRNA expression of TNF-α (A, D) and MMP9 (B, E) in 786-O and ACHN cells, respectively. Protein expressions of p-NF-κB p65, TNF-α, MMP9, and cleaved caspase1 were determined by western blot (C, F).
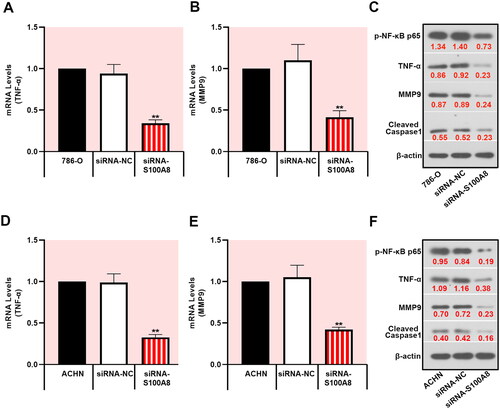
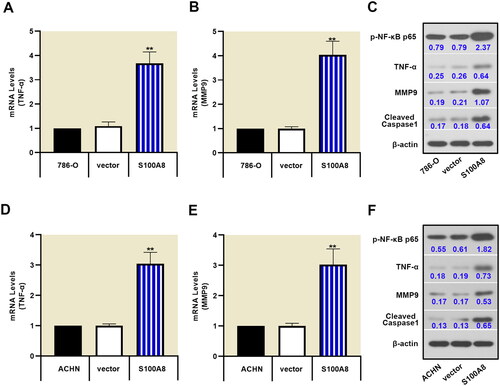
Figure 5. S100A8 overexpression promoted the activation of the NF-κB pathway. Relative mRNA expression of TNF-α (A, D) and MMP9 (B, E) by real-time PCR in 786-O and ACHN cells. Western blot for protein expressions of p-NF-κB p65, TNF-α, MMP9, and cleaved caspase1 in RCC cells (C, F).
Supplemental Material
Download Zip (1,002.1 KB)Data availability statement
The datasets partly generated in this study are publicly available in GEO at GSE100666 [https://www.ncbi.nlm.nih.gov/geo/query/acc.cgi?acc=GSE100666]. All data generated during the current study are available from the corresponding author on reasonable request.