
Figures & data
Table 1. Clinical characteristics of GLM with EN.
Figure 1. The skin lesions of Case 7 (a–c) and Case 12 (d).
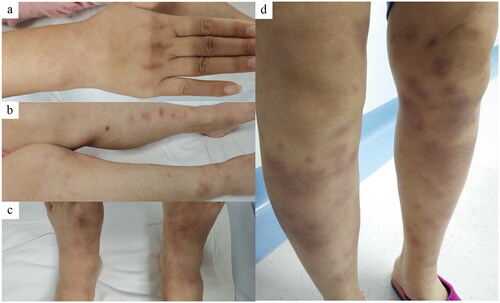
Figure 2. Images of Case 7. (a-b) Breast appearance before and after treatment. Her left breast is erythematous and swollen with nipple retraction (a). There are scars of some pus drainage incisions on the surface, while the appearance is intact (b). (c–d) Ultrasound images before and after treatment. The normal glandular structure had almost disappeared, replaced by diffuse abscess formation (c). basically normal gland structure with a residual small hypoechoic area after treatment (d).
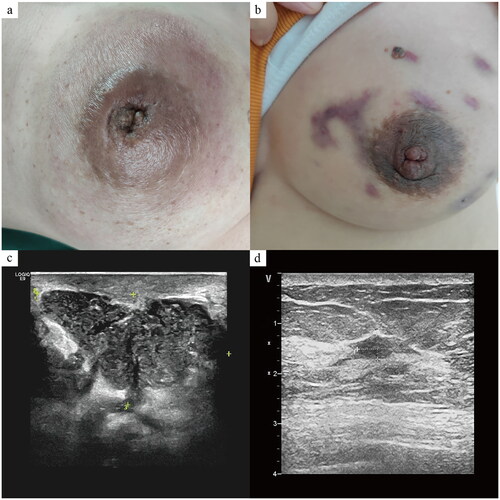
Figure 3. The comparison results of blood indicators. (a–c) WBC (white blood cell count), ANC (absolute neutrophil count), and NLR (neutrophil-to-lymphocyte ratio) of the EN group were higher than those of the non-EN group (p = 0.025, 0.014, 0.002, respectively). (d) ALC (absolute lymphocyte count) in the EN group was lower than in the non-EN group (p = 0.013). (e) The difference in PLR between the two groups was not statistically significant (p = 0.068). (f) The ROC curve analysis of NLR for the occurrence of EN. (*p < 0.05, **p < 0.01).
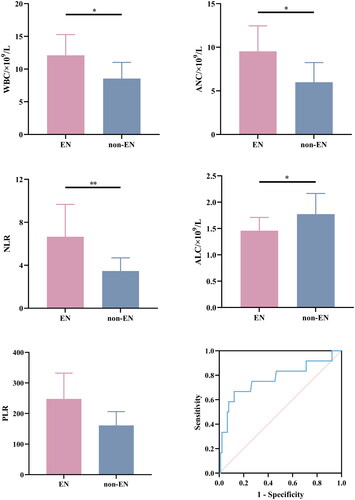
Table 2. Clinical and laboratory findings of GLM patients with and without EN.
Table 3. Spearman correlation coefficient based on EN.