
Figures & data
Figure 1. A consort diagram of the patients enrolled in this study.
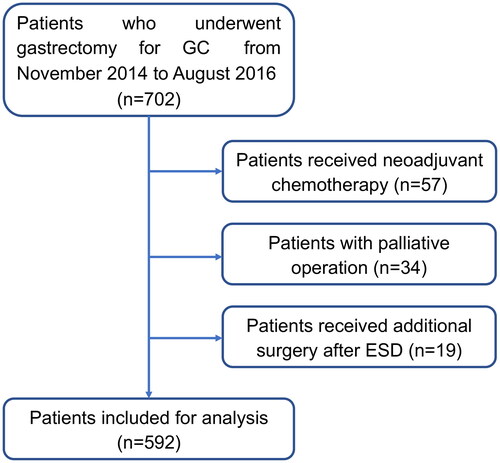
Figure 2. (A) The representative microphotographs of neural invasion (NI) in gastric cancer assessed by HE staining (magnification: ×200, scale bar: 10 μm). NI was assessed as positive if the cancer cells presented along the sides of nerves and/or inside the epineurial, perineurial and endoneurial spaces of the neuronal sheath. (B) The nerve fiber was confirmed with the immunohistochemistry of a specific neuronal marker (PGP9.5).
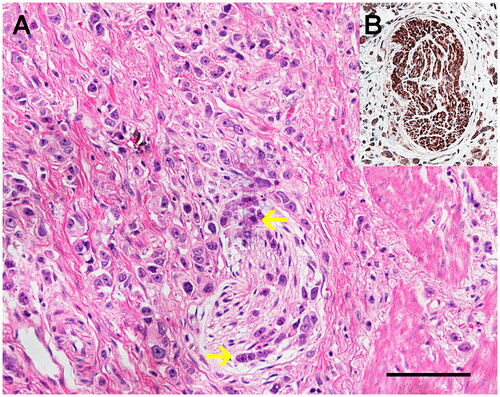
Table 1. Association of neural invasion (NI) status and other clinical-pathological characteristics.
Figure 3. Kaplan–Meier curves for overall survival according to the positivity of NI.
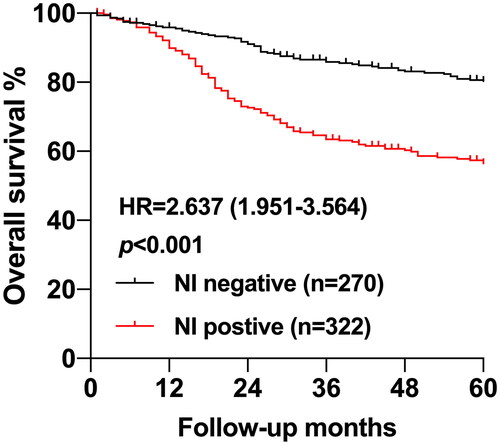
Table 2. Univariate and Multivariate Cox regression analysis of overall survival in 592 GC patients, *p < 0.05, ** p < 0.01, ***p < 0.001.
Table 3. Univariate survival analysis according to NI status, stratification for different clinical-pathological variable, *p < 0.05, **p < 0.01, ***p < 0.001.
Figure 4. Multivariate Cox regression survival analysis according to NI status, stratification for different clinical-pathological variable, * p < 0.05, ** p < 0.01, *** p < 0.001. # the proportion of NI positive patients in early stage subgroup was too small for analysis.
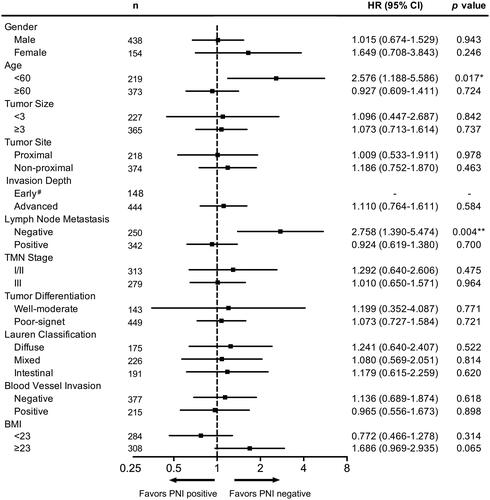
Table 4. Multivariate Cox regression survival analysis according to the combination of NI status with other clinical-pathological variables, *p < 0.05, **p < 0.01, ***p < 0.001. NI: Neural invasion, LNM: Lymph node metastasis, BVI: Blood vessel invasion. #The sample size of early GC (pT1) & NI + subgroup was not enough for analysis.
Supplemental Material
Download TIFF Image (2.1 MB)Data availability statement
The raw data supporting the conclusions of this article will be made available by the authors, without undue reservation.