Figures & data
Figure 1. 18F-FDG imaging shows that YAP overexpression is associated with glycolysis in BC. (A) qRT-PCT assay to measure YAP levels in BC cells. (B) The protein levels of YAP. (C, D) Typical 18F-FDG PET/CT imaging of patients with low (C) or high (D) SUVmax levels. (E) IHC assay assessment of YAP in patients with low and high SUVmax. Typical IHC images of YAP, CTGF, and HK2 in patients with low and high SUVmax. Data are mean ± SD for triplicate experiments. *p < 0.05, **p < 0.01, ***p < 0.001.
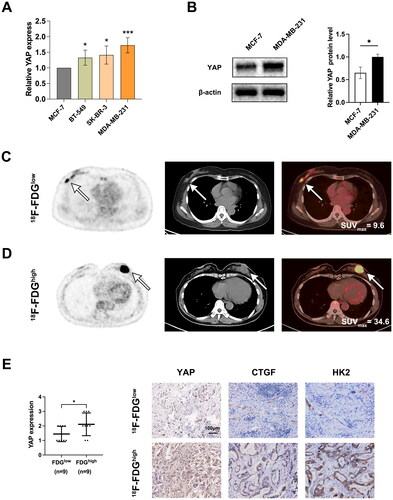
Figure 2. YAP promotes glycolysis in BC cells. (A) ECAR levels (left) and basal and compensatory glycolytic rates (right) in BT-549 cells transfected with si-YAP or control RNA. (B) the OCR levels of indicated BT-549 cells were measured. (C) ECAR levels (left) and basal and compensatory glycolytic rates (right) in SK-BR-3 cells transfected with si-YAP or control RNA. (D) OCR levels of indicated SK-BR-3 cells. Data are mean ± SD for triplicate experiments. *p < 0.05, **p < 0.01, ***p < 0.001.
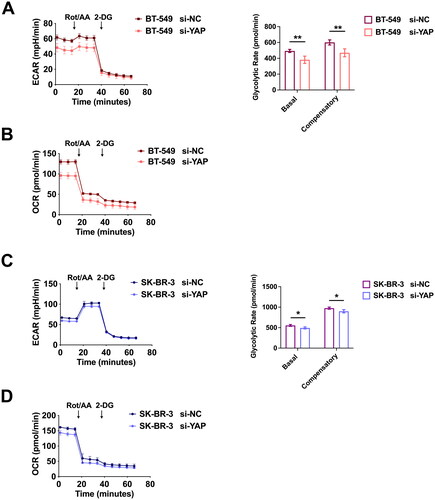
Figure 3. YAP promotes the growth of BC cells. (A) the knockdown efficiency of YAP in BT-549 cells. (B) the overexpression efficiency of YAP in BT-549 cells. (C-D) the EdU assay demonstrated that YAP knockdown inhibited BC cell growth (C), while YAP overexpression promoted BC cell growth (D), respectively. (E-F) Migration ability determined by Transwell assay demonstrated that YAP knockdown inhibited BC cell migration (E), while YAP overexpression promoted BC cell migration (F), respectively. Data are mean ± SD for triplicate experiments. *p < 0.05, **p < 0.01, ***p < 0.001.
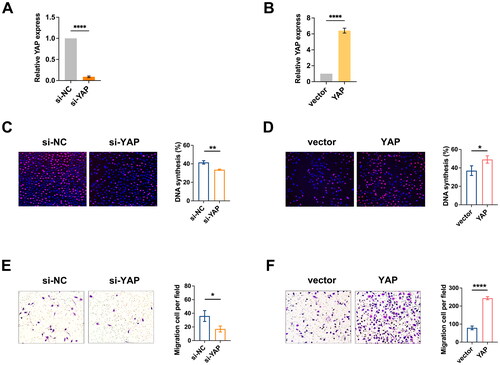
Figure 4. Detection of YAP binding to HuR in BC cells. (A) Analysis of the GEPIA database revealed a positive correlation between HuR and YAP in BC samples. (B) The RIP assay demonstrated that the HuR antibody significantly enriched YAP mRNA in BC cells. (C) The FISH assay verified the colocalization of endogenous HuR and YAP in cytoplasm. (D) Knockdown efficiency of HuR in BC cells. (E-F) Following HuR knockdown, mRNA (E) and protein (F) expression of YAP were downregulated. Data are mean ± SD for triplicate experiments. *p < 0.05, **p < 0.01, ***p < 0.001.
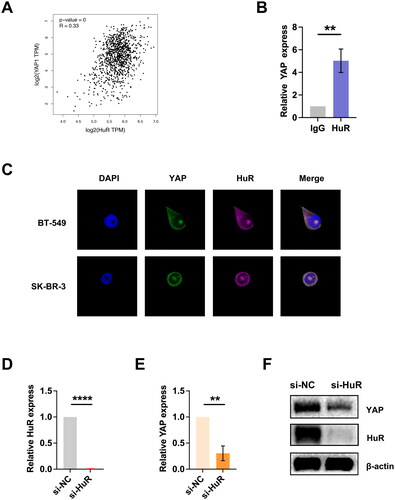
Figure 5. VP inhibits YAP activity in BC cells. (A) the cell line viability curve was used to determine the IC50 of VP for each cell line after 48 h of drug treatment. (B) the BC cell line viability curve was used to determine the IC50 of VP for each cell line after 72 h of drug treatment. (C) mRNA levels of YAP after VP treatment in the BT-549 and MDA-MB-231 cell lines. (D) mRNA levels of CTGF with VP treatment in the BT-549 and MDA-MB-231 cell lines. (E) YAP protein levels in cell lines treated with VP. Data are mean ± SD for triplicate experiments. *p < 0.05, **p < 0.01, ***p < 0.001.
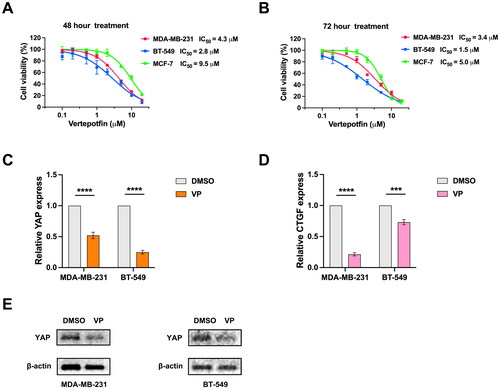
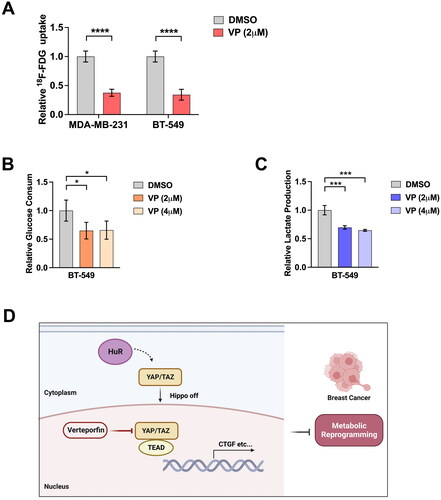
Figure 6. Effects of VP therapy on glycolysis in BC cells. (A) 18F-FDG uptake rates in BT-549 and MDA-MB-231 cell lines after VP. (B) Glucose consumption by BT-549 cells after indicated doses of VP. (C) Lactate production of BT-549 cells after indicated doses of VP. (D) Schematic diagram describing the role of YAP in glycolysis of BC. Data are mean ± SD for triplicate experiments. *p < 0.05, **p < 0.01, ***p < 0.001.