
Figures & data
Table 1. Primer sequence of the examined genes.
Figure 1. A: Wound healing in diabetic rats from the five experimental groups at days zero, three, seven, ten, and fourteen; B: Percentage of wound healing on day 1. The mean (n = 8) ± standard deviation was used to express the data. * vs. Control group; # vs. Diabetic group; @ vs. Diabetic + ZW group, and $ vs. Diabetic + dapagliflozin group.
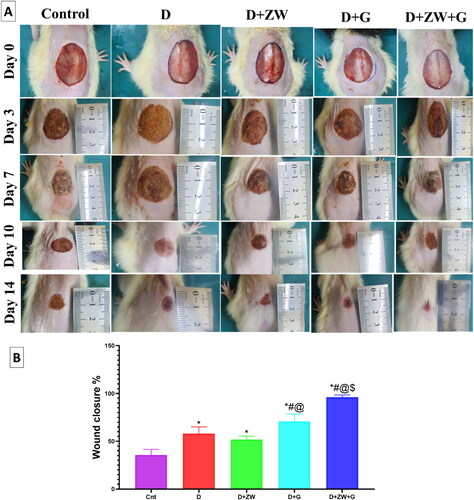
Figure 2. Representative photomicrograph of skin from different treatment groups. A: Control skins show a normal histological appearance of the epidermis and dermis in low-power and inset images. B: Skins of the diabetic group show extensive ulceration with numerous neutrophilic infiltrations and scanty granulation tissue (thick arrow), inset, adjacent epidermis showing marked neutrophilic aggregates (arrowhead) invading and surrounding the hyperplastic epithelium. C: the diabetic group shows cellular crust (thick arrow), and the dermal layers show hemorrhage admixed with a mild number of cellular infiltrates (thin arrow), inset, the adjacent epithelium is hyperplastic with acanthosis and spongiosis (arrowhead). D: the diabetic + ZW group typically arranged complete epidermal layers (line) with dermal ectatic blood capillary (arrowhead) and few inflammatory cells, focal edema (star), and dense granulation tissue. E: the diabetes + dapagliflozin group showed a complete epidermis with extensive epidermal hyperplasia (thick arrow) with thickened dermal collagen deposition and diminished blood vessels (thin arrow), inset, the hyperplastic epidermal cells showed few vacuolar degenerations (arrowhead). F: the diabetic + ZW + dapagliflozin group shows mild epidermal thickening (line) with fibroblast proliferation, collagen deposition, and enhanced newly vascular formation, inset, fibroblast infiltrations, and increased blood vessels. Image magnification = 400X, bar = 50 µm.
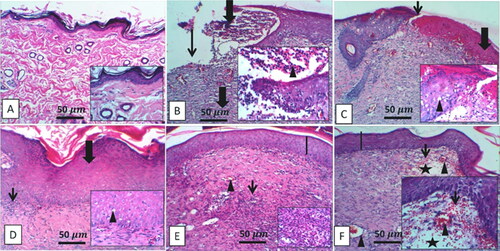
Figure 3. Representative Masson trichrome staining shows collagen deposition in wound tissue of different experimental groups. A: Deep blue coloration of collagen deposition in the control group. B and C: Sparse, thin, disorderly collagen deposition in diabetic groups. D and E: High collagen deposition in diabetic + ZW and diabetic + dapagliflozin. F: Intense collagen matrix deposition in the diabetic + ZW + dapagliflozin group. Image magnification = 400X, bar = 50 µm.
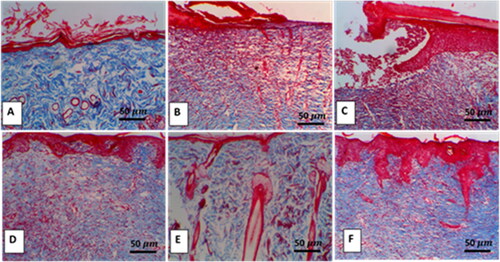
Figure 4. The combined effect of ZW and dapagliflozin on the mean value of oxidative stress markers in diabetic wounds (a–D). A: MDA nmol/mg. B: GPX ng/mg. C: Catalase ng/mg. D: SOD u/mg. * vs. control group; # vs. Diabetic group; @ vs. Diabetic + ZW group, and $ vs. Diabetic + dapagliflozin group.
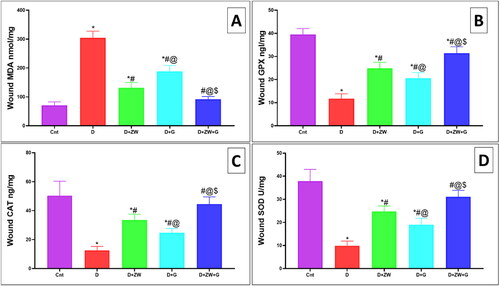
Figure 5. Representative photomicrograph of NF-κB expression in skin section of different groups. A: the control group shows no expression. B: the diabetic group shows high expression in epidermal and dermal cells, inset, high expression in the cytoplasm of invading polymorphonuclear and mononuclear cells. C and D: the Diabetic + ZW and diabetic + dapagliflozin groups show few expressions in epidermal and dermal cells. E: the diabetic + ZW + dapagliflozin group shows mild expression in epidermal and dermal cells. F: Histogram shows the percentage of skin that was immunostained with NF-κB. * vs. Control group; # vs. Diabetic group; @ vs. Diabetic + ZW group, and $ vs. Diabetic + dapagliflozin group. Image magnification = 400X, bar = 50 µm.
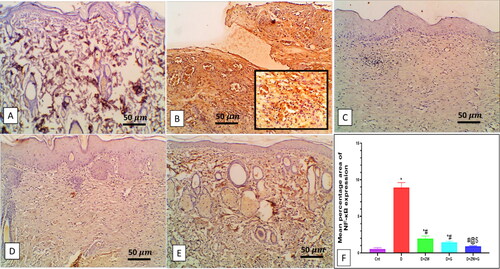
Figure 6. Impact of the combined effect of ZW and dapagliflozin on the protein level of A: IL-1β; B: IL6; C: TNF-α; D: Ang II; and E: HIF-1α by elisa assay. * vs. Control group; # vs. Diabetic group; @ vs. Diabetic + ZW group, and $ vs. Diabetic + dapagliflozin group.
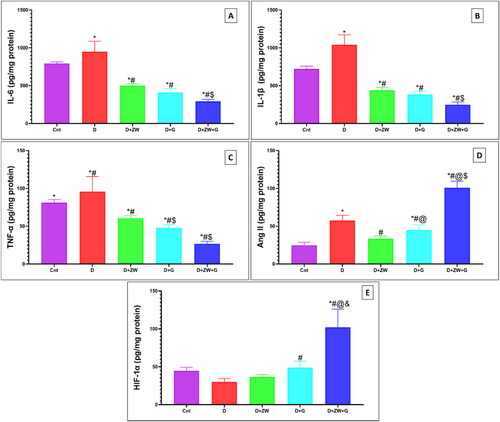
Figure 7. Representative photomicrograph of CD45 immunoexpression in skin section of different groups. A: the control group shows no expression of CD45-positive cells in lower and higher power images (inset images). B: the diabetic group shows high expression in the dermal capillary, Intravascular blood cells, and dermal cellular infiltrates. C) The diabetic + ZW group shows few epidermal and dermal expression, inset, few positive immunostained epidermal and subepidermal endothelial cells. D and E: the diabetic + dapagliflozin and diabetic + ZW + dapagliflozin groups show faint expression in dermal tissue. F: Histogram showing the percentage of skin that was immunostained with CD45. * vs. Control group; # vs. Diabetic group; @ vs. Diabetic + ZW group, and $ vs. Diabetic + dapagliflozin group. Image magnification = 400X, bar = 50 µm.
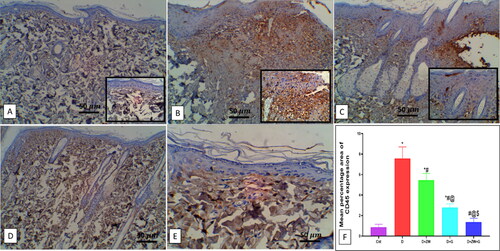
Figure 8. Effect of ZW and dapagliflozin on the gene expression of A: TGF-β1; B: MMP-2; C: Col1A1; D: EGF-β1; and E: FGF. * vs. Control group; # vs. Diabetic group; @ vs. Diabetic + ZW group, and $ vs. Diabetic + dapagliflozin group.
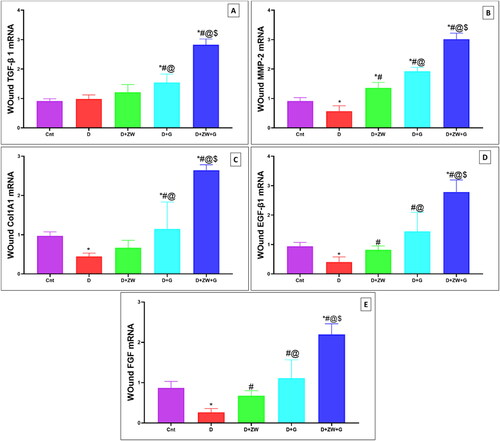
Figure 9. Representative photomicrograph of Ki-67 immunoexpression in skin section of different experimental groups. A: the control group shows no Ki-67 immunostained positive cells. C: the Diabetic + ZW and D: the diabetic + dapagliflozin groups show the same expression level of Ki-67 with high nuclear staining of epidermal cells. B: the diabetic group shows a moderate expression of Ki-67 in epidermal and dermal cells, inset, positive nuclear staining of epidermal, endothelial, and fibroblast cells. E: the diabetic + ZW + dapagliflozin group shows a strong nuclear expression of Ki-67 in epidermal and dermal cells. F: Histogram presented the percentage of skin immunostained with Ki 67. * vs. Control group; # vs. Diabetic group; @ vs. Diabetic + ZW group, and $ vs. Diabetic + dapagliflozin group. Image magnification = 400X, bar = 50 µm (A, B, C, and D), bar= 100 µm (E).
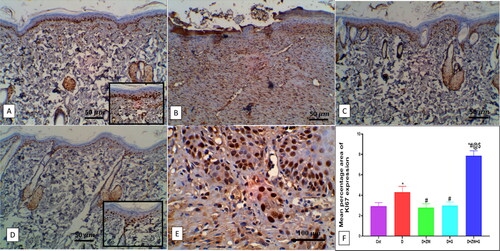
Figure 10. Representative photomicrograph of CD34 immunoexpression in skin section of different treatment groups. A: the control group shows no expression of CD34. B: the diabetic group shows a moderate expression of CD34 in dermal tissue, and the Insets show moderate cytoplasmic and nuclear expression in invading inflammatory and capillary endothelial cells. C: the diabetic + ZW group shows minimal focal expression in the cytoplasm of superficial epidermal cells. D: the diabetic + dapagliflozin group shows a mild expression of CD34 with little epidermal expression and mild expression in subepidermal cellular infiltrate and vascular endothelial cells. E: the diabetic + ZW + dapagliflozin group shows high expression in epidermal cells, dermal endothelial cells, inset, moderate expression in endothelial cells with few expressions in inflammatory cells. F: Histogram showing the percentage of skin that was immunostained with CD34. * vs. Control group; # vs. Diabetic group; @ vs. Diabetic + ZW group, and $ vs. Diabetic + dapagliflozin group. Image magnification = 400X, bar = 50 µm.
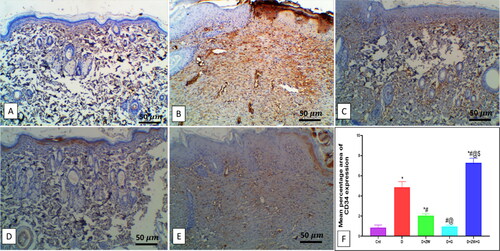
Figure 11. Representative immunohistochemical Micrograph of VEGF expression in skin sections of different groups. A: the control group shows a faint expression of VEGF in the dermal blood vessel. B: the diabetic group shows mild expression in dermal blood vessels. C: the diabetic + ZW group shows minimal expression in dermal endothelial and fibroblastic cells; see inset. D: the diabetic + dapagliflozin group shows few expressions in dermal vessels and fibroblasts. E: the diabetic + ZW + dapagliflozin group shows a high expression of VEGF in vascular endothelial and fibroblast cells; see inset. F: Histogram of the percentage of skin that was immunostained with VEGF. * vs. Control group; # vs. Diabetic group; @ vs. Diabetic + ZW group, and $ vs. Diabetic + dapagliflozin group. Image magnification = 400X, bar = 50 µm.
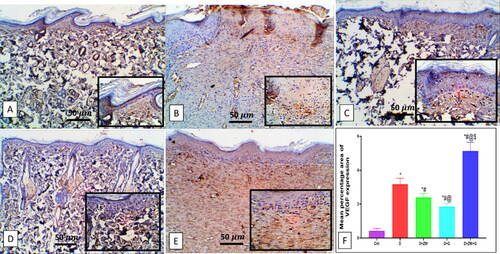
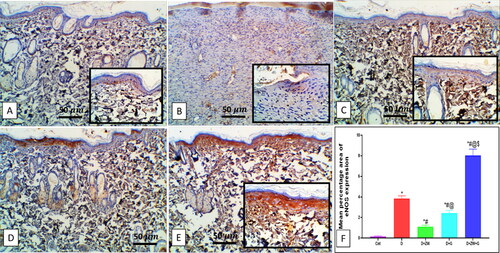
Figure 12. Representative photomicrograph of eNOS immunoexpression in the skin sections of different experimental groups. A: No expression in the control group. B: the diabetic group shows moderate expressions in dermal vascular endothelium and invading cells. C and D: the diabetic + ZW and diabetic + dapagliflozin groups show few expressions in dermal vascular endothelium and invading cells. E: the diabetic + ZW + dapagliflozin group shows high expression in epidermal cells, dermal vascular endothelial blood vessels, blood cells, invading cells, insert, high expression in the cytoplasm of invading polymorphonuclear and mononuclear cells, vascular endothelial cells. Faint to mild expression in the sebaceous gland and invading Mono- and polymorphonuclear cells. F: Histogram represented the percentage of skin that was immunostained with eNOS. * vs. Control group; # vs. Diabetic group; @ vs. Diabetic + ZW group, and $ vs. Diabetic + dapagliflozin group. Image magnification = 400X, bar = 50 µm.
Data availability statement
The data that support this research will be shared upon reasonable request to the corresponding authors.