Figures & data
Figure 1. A flow diagram of study selection.
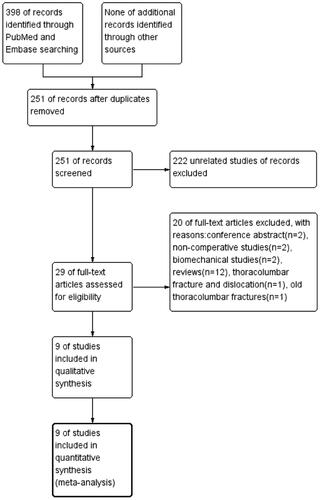
Figure 2. Network of the comparisons for the Bayesian network meta-analysis. Note: 1: anterior approach; 2: posterior approach; 3: anterior-posterior approach.
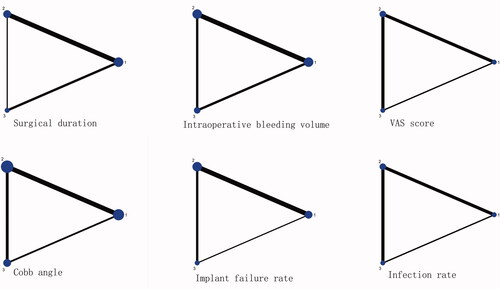
Table 1. Patient and study characteristics of the included studies in the network meta-analysis.
Table 2. Detsky quality Scores of the included randomized controlled trials.
Figure 3. Funnel plot of this network meta-analysis. Note: 1: anterior approach; 2: posterior approach; 3: anterior-posterior approach.
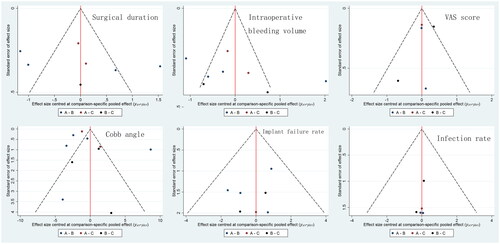
Figure 4. Loop inconsistency plot of this network meta-analysis. Note: 1: anterior approach; 2: posterior approach; 3: anterior-posterior approach.
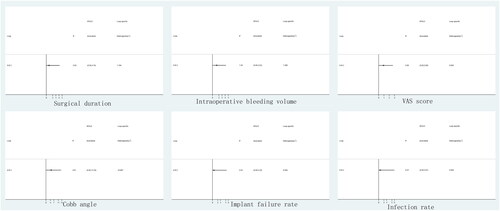
Figure 5. Forest Interval plot of this network meta-analysis. Note: 1 = A: anterior approach; 2 = B: posterior approach; 3 = C: anterior-posterior approach.
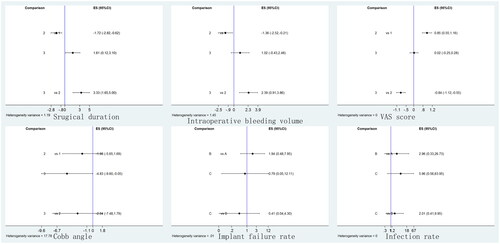
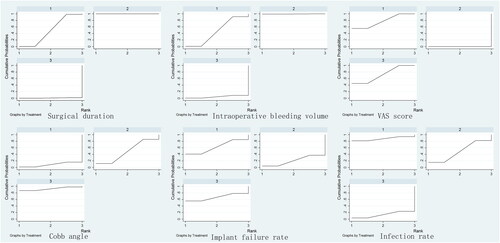
Figure 6. SUCRA Of this network meta-analysis. Note: 1: anterior approach; 2: posterior approach; 3: anterior-posterior approach.