
Figures & data
Figure 1. A flowchart of the inclusion process for patients with CD. A total of 255 patients who met the inclusion criteria were enrolled in the study.
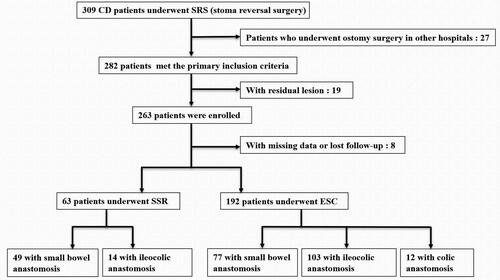
Figure 2. Preoperative, intraoperative and postoperative pictures (I, II, and III) of stoma reversal surgery. (A) The end stoma closer (ESC). (B) The split stoma reversal (SSR).
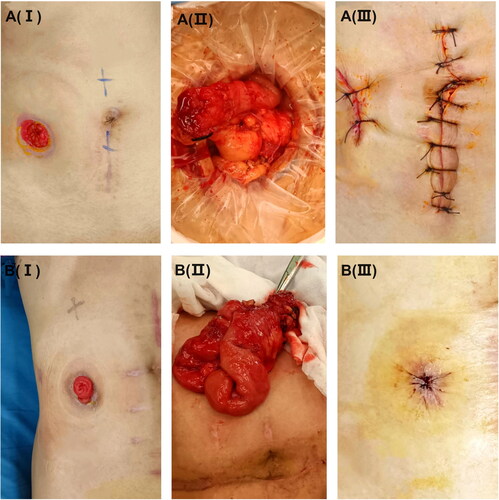
Table 1. Demographic and disease characteristics of 255 patients with CD who underwent stoma reversal surgery.
Table 2. Surgical information of 255 patients with CD who underwent stoma reversal surgery.
Figure 3. The Kaplan–Meier curve of patients (SSR vs. ESC) during follow-up.
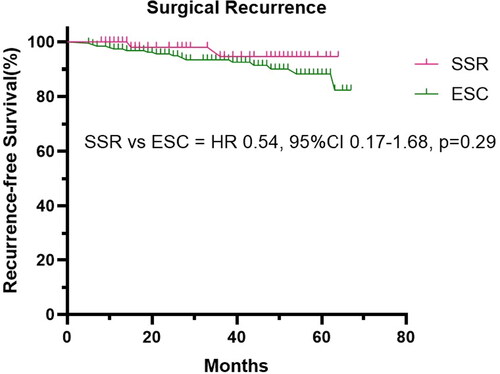
Table 3. Postoperative outcomes of 255 patients with CD who underwent stoma reversal surgery.
Supplemental Material
Download ()Data availability statement
The database is available if properly requested and can be directly addressed to the corresponding author’s email address.