Figures & data
Figure 1. Profiles of anvils with different dimple diameters (DDs). Vs denotes the available volumes of the sample in the pair of encapsulating gaskets when using each anvil.
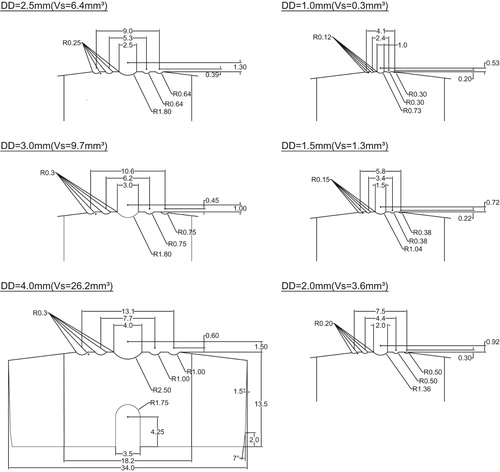
Figure 2. Diffraction geometry in the experiments using a PE press at PLANET.
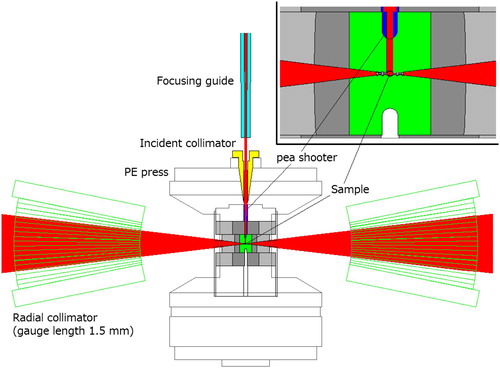
Figure 3. Typical diffraction patterns obtained for a mixture of NaCl and MgO powder using the anvils with DD = 2.5 mm. The intensity is not corrected by the data for a vanadium rod and empty gaskets. The exposure time was about 20 min for each pattern when the proton accelerator was operated at the beam power of 500 kW.
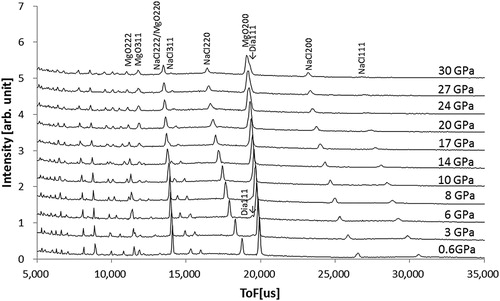
Figure 4. Pressure-load relations when using anvils with different dimple diameters (DDs). (Inset) Comparison of the initial slope of the pressure generation curves against the area of the dimple.
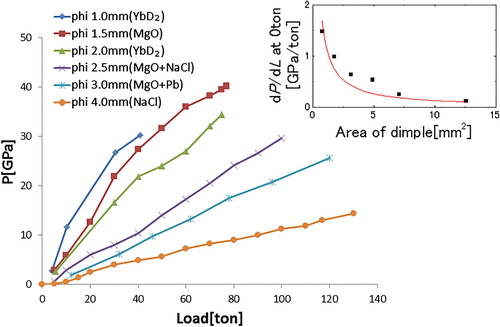
Figure 5. Diffraction patterns at the highest pressure in each test using anvils with various dimple diameters (DDs). All the diffraction patterns were calculated with the same binning condition (Δt = 40 μs in ToF) after normalization by the number of neutrons introduced to the beamline and detector region. The intensity is not corrected by the data for a vanadium rod and empty gaskets. Dotted lines represent the positions expected for 111, 220, 311 diamond peaks.
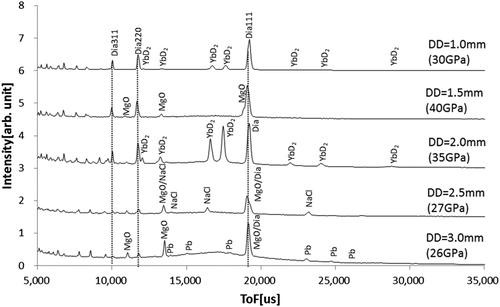
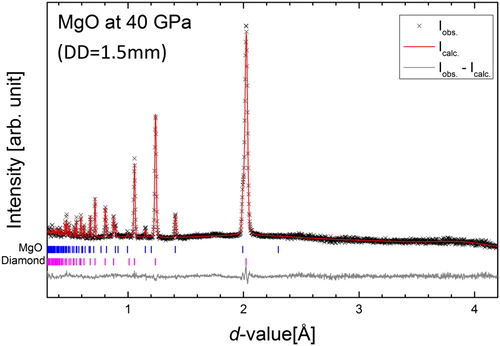
Figure 6. Results of Rietveld fitting for the data of MgO at 40 GPa. The data was taken using the anvils with DD = 1.5 mm. The exposure time was 71 min when the proton accelerator was operated at the beam power of 500 kW.