Figures & data
Figure 1. Example of a Version 4 jcpds file. The 6 parameters used to establish the thermal EoS are K0, K0P, DK0DT, DK0PDT, ALPHAT and DALPHADT.
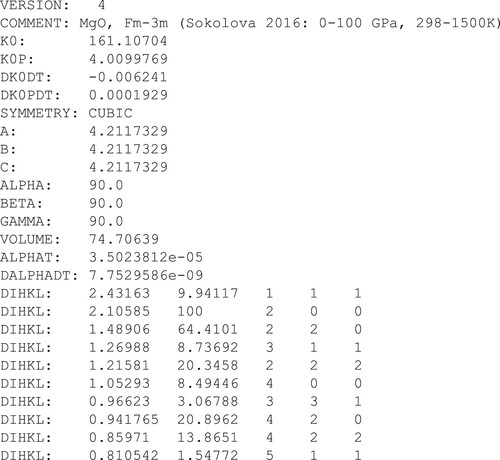
Figure 2. Descriptions of the input parameters of a Version 4 jcpds file [Citation11].
![Figure 2. Descriptions of the input parameters of a Version 4 jcpds file [Citation11].](/cms/asset/f983044f-1039-45f1-8305-7c3ba62c1510/ghpr_a_2187294_f0002_ob.jpg)
Figure 3. The solid data points show (a) the 0 GPa volumetric thermal expansion, and (b) the 298 K isothermal compressibility of MgO, as calculated from the Sokolova et al. thermal EoS [Citation21]. The dashed line in (a) is the best fit to the thermal expansion using Equation (Equation8(8)
(8) ), while the dashed line in (b) is the best fit to the compressibility using a 3rd order Birch-Murnaghan EoS. The unfilled data points in (a) show the thermal expansion of MgO at 0.01 GPa, as calculated by Dioptas using the jcpds input file shown in . At a given temperature and this very low, but non-zero pressure, most of the MgO unit cell volumes calculated by Dioptas are greater than the associated volumes on the P=0 isobar, particularly at high temperatures. Effectively, Dioptas produces isotherms exhibiting expansion upon compression within a narrow pressure range. The reasons for this non-physical response are described in the main text.
![Figure 3. The solid data points show (a) the 0 GPa volumetric thermal expansion, and (b) the 298 K isothermal compressibility of MgO, as calculated from the Sokolova et al. thermal EoS [Citation21]. The dashed line in (a) is the best fit to the thermal expansion using Equation (Equation8(8) V=V0(1+αT(T)ΔT)=V0(1+α298ΔT+∂αT∂T|298ΔT2)(8) ), while the dashed line in (b) is the best fit to the compressibility using a 3rd order Birch-Murnaghan EoS. The unfilled data points in (a) show the thermal expansion of MgO at 0.01 GPa, as calculated by Dioptas using the jcpds input file shown in Figure 1. At a given temperature and this very low, but non-zero pressure, most of the MgO unit cell volumes calculated by Dioptas are greater than the associated volumes on the P=0 isobar, particularly at high temperatures. Effectively, Dioptas produces isotherms exhibiting expansion upon compression within a narrow pressure range. The reasons for this non-physical response are described in the main text.](/cms/asset/ee01f290-53ac-4d21-9af4-7ae997fb387f/ghpr_a_2187294_f0003_ob.jpg)
Figure 4. The differences in pressures calculated by the Sokolova et al. thermal EoS for MgO as a function of the unit cell volume and temperature, and the reparameterisation suitable for use in Dioptas via import of a jcpds file. The shown volume scale equates to a pressure range of approximately 0–100 GPa.
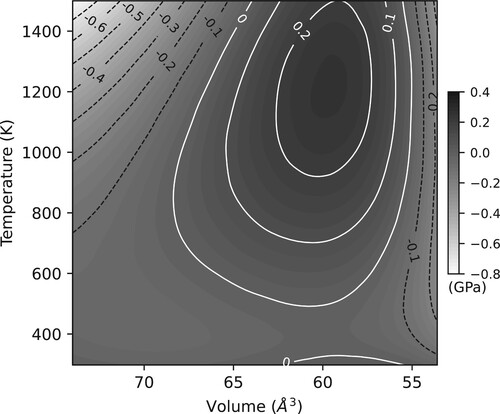
Figure 5. The 298, 1000 and 1500 K isotherms for MgO represented by the black dashed lines, as calculated using the thermal EoS of Sokolova et al. [Citation21]. The black square data points show a number of P-V data points along the three isotherms, as calculated by Dioptas using the jcpds file shown in .
![Figure 5. The 298, 1000 and 1500 K isotherms for MgO represented by the black dashed lines, as calculated using the thermal EoS of Sokolova et al. [Citation21]. The black square data points show a number of P-V data points along the three isotherms, as calculated by Dioptas using the jcpds file shown in Figure 1.](/cms/asset/eb5a79b2-545e-4c23-b935-1334fee0f9c1/ghpr_a_2187294_f0005_ob.jpg)
Figure 6. The 298, 1000 and 2000 K isotherms for Ne, as calculated using the thermal EoS of Fei et al. [Citation23] are shown by the black dashed lines. The filled squares show a number of P-V data points along the 1000 and 2000 K isotherms, as calculated by Dioptas using the jcpds file input parameters for Ne given in .
![Figure 6. The 298, 1000 and 2000 K isotherms for Ne, as calculated using the thermal EoS of Fei et al. [Citation23] are shown by the black dashed lines. The filled squares show a number of P-V data points along the 1000 and 2000 K isotherms, as calculated by Dioptas using the jcpds file input parameters for Ne given in Table 1.](/cms/asset/2490f726-a8cd-42a4-ad6e-6c76c68bb840/ghpr_a_2187294_f0006_ob.jpg)
Table 1. The optimised thermal EoS parameters required for the jcpds files of various materials. is the unit cell volume for each material at ambient pressure, while the meanings of the other parameters are described in the main text.
Table 2. The as-published parameters for the room temperature AP2 EoS of Mo [Citation32], and the Vinet EoS of Au and Pt [Citation34].
Figure 7. The 298, 1000, 2000 and 3000 K isotherms for hcp-Fe (ϵ-Fe), as calculated using the thermal EoS of Dorogokupets et al. [Citation25]. The filled squares show a number of P-V data points along the 1000, 2000 and 3000 K isotherms, as calculated by using the jcpds file input parameters for hcp-Fe given in .
![Figure 7. The 298, 1000, 2000 and 3000 K isotherms for hcp-Fe (ϵ-Fe), as calculated using the thermal EoS of Dorogokupets et al. [Citation25]. The filled squares show a number of P-V data points along the 1000, 2000 and 3000 K isotherms, as calculated by using the jcpds file input parameters for hcp-Fe given in Table 1.](/cms/asset/7e76aca8-ce51-4960-9ebd-163a66b29797/ghpr_a_2187294_f0007_ob.jpg)
Figure 8. The 300, 2000 and 3000 K isotherms for the B2 phase of KCl, as calculated using the thermal EoS of Dewaele et al. [Citation29]. The filled squares show a number of data points along the same isotherms, as calculated by using the jcpds file input parameters for B2-KCl given in .
![Figure 8. The 300, 2000 and 3000 K isotherms for the B2 phase of KCl, as calculated using the thermal EoS of Dewaele et al. [Citation29]. The filled squares show a number of data points along the same isotherms, as calculated by using the jcpds file input parameters for B2-KCl given in Table 1.](/cms/asset/b3d391cd-1c6c-4823-afb2-149f607ba368/ghpr_a_2187294_f0008_ob.jpg)
Figure 9. The room temperature equations of state of Mo, Cu, Au and Pt to 300 GPa. The data points show the calculated compressions using published AP2 (Mo) [Citation32], 3rd order Vinet (Cu) [Citation33], and 2nd order Vinet (Au and Pt) equations of state [Citation34]. The dashed lines through the data points are the best-fitting B-M equations of state, using the parameters listed in .
![Figure 9. The room temperature equations of state of Mo, Cu, Au and Pt to 300 GPa. The data points show the calculated compressions using published AP2 (Mo) [Citation32], 3rd order Vinet (Cu) [Citation33], and 2nd order Vinet (Au and Pt) equations of state [Citation34]. The dashed lines through the data points are the best-fitting B-M equations of state, using the parameters listed in Table 1.](/cms/asset/de084c2e-c986-4b1b-8aee-9bace5f5f95a/ghpr_a_2187294_f0009_ob.jpg)
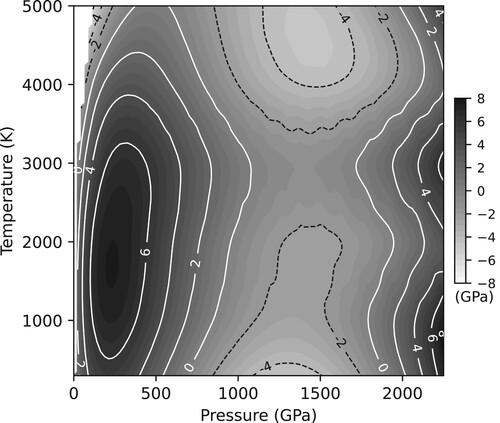
Figure 10. The differences in pressures between those calculated by the Gorman et al. thermal EoS for Ta, and those calculated by Dioptas using the parameters given in . Despite the very large P-T range (2300 GPa and 5000 K) the maximum difference between the two equations of state is only ∼8 GPa at 240 GPa and 1750 K. No contours are shown in the white area at low pressures (<100 GPa) and high temperatures (3300–5000 K) as Ta is in the liquid state at such conditions.