
Figures & data
Figure 1. Representative transient temperature curves and a cross-section image obtained in the same run. (a) The curves obtained at 121 GPa and 300 K and at 124 GPa and 1700 K. The black lines represent the obtained signals, and the red lines denote the fitting results obtained using Equation (1). (b) Cross-sectional SEM image of the Pt sample after the TR measurements. Representative transient temperature curves and a cross-section image for the Pt–MgO–Pt sample obtained in the same run. (c) The curves obtained at 130 GPa and 300 K and at 140 GPa and 1950 K. The black lines are the obtained signals, and the red lines are the fitting results obtained using Equation (1). (d) Cross-sectional SEM image of the Pt–MgO–Pt sample after the TR measurements.
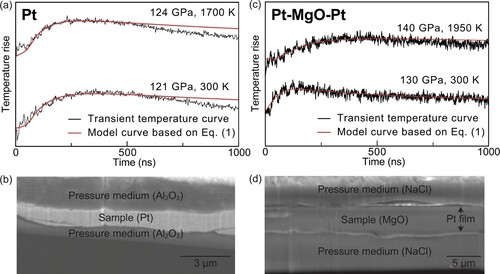
Figure 2. Temperature dependence of the thermal diffusivity (a) and conductivity (b) of Pt at high pressures. Circles denote the results obtained here by the thermoreflectance method, red, 121 GPa; blue, 91 GPa; and yellow, 12 GPa, and those from our previous report [Citation4], green, 58 GPa and purple, 40 GPa. Our current and previous data are shown with closed and open circles, respectively. Open triangles indicate results obtained by the flash heating method [Citation16]: green, 55 GPa and purple, 35 GPa. Gray crosses indicate the recommended values at ambient pressure [Citation13]. Solid lines indicate our formulated thermal conductivity (Equation (4)). The colors of the solid lines represent the same pressures as the circles of the same color, and the gray line denotes the conductivity at 1 bar. Broken curves indicate the calculated thermal conductivity of Pt [Citation15]: red, 150 GPa; blue, 90 GPa; green, 60 GPa; purple, 40 GPa; yellow, 10 GPa; and gray, 0 GPa.
![Figure 2. Temperature dependence of the thermal diffusivity (a) and conductivity (b) of Pt at high pressures. Circles denote the results obtained here by the thermoreflectance method, red, 121 GPa; blue, 91 GPa; and yellow, 12 GPa, and those from our previous report [Citation4], green, 58 GPa and purple, 40 GPa. Our current and previous data are shown with closed and open circles, respectively. Open triangles indicate results obtained by the flash heating method [Citation16]: green, 55 GPa and purple, 35 GPa. Gray crosses indicate the recommended values at ambient pressure [Citation13]. Solid lines indicate our formulated thermal conductivity (Equation (4)). The colors of the solid lines represent the same pressures as the circles of the same color, and the gray line denotes the conductivity at 1 bar. Broken curves indicate the calculated thermal conductivity of Pt [Citation15]: red, 150 GPa; blue, 90 GPa; green, 60 GPa; purple, 40 GPa; yellow, 10 GPa; and gray, 0 GPa.](/cms/asset/c0a200ee-3abe-4f12-ab10-cd6138c55229/ghpr_a_2193892_f0002_oc.jpg)
Table 1. Experimental pressures (P), temperatures (T), heat diffusion times (τ), sample thicknesses (d), thermal diffusivity (D), densities (ρ), isobaric heat capacities (CP), and thermal conductivities (κ) of Pt.
Figure 3. Thermal diffusivity of MgO at high P–T conditions. Triangles, ρ = 3.83 g/cm3 at 300 K (12 GPa); squares, ρ = 4.28 g/cm3 at 300 K (44 GPa); diamonds, ρ = 4.73 g/cm3 at 300 K (80 GPa); circles, ρ = 5.18 g/cm3 at 300 K (130 GPa). See for changes in experimental pressure due to the effect of thermal pressure during high-T TR measurements.
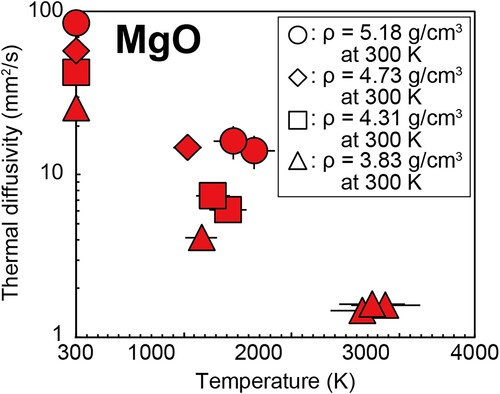
Table 2. Experimental pressures (P), temperatures (T), thermal diffusivity (D), densities (ρ), isobaric heat capacities (CP), and thermal conductivities (κ) of MgO.
Figure 4. Thermal conductivity of MgO at 300 K as a function of pressure. Experimental data are shown as symbols. Red circles represent our results, open circles represent MgO single crystal [Citation22], open squares represent polycrystalline MgO [Citation27], and open triangles represent polycrystalline MgO [Citation31]. Our suggested density dependence based on Equation (5) and the theoretical data reported in literature are shown using solid curves: red represents this study, cyan represents Ref. [Citation23], green represents Ref. [Citation34], yellow represents Ref. [Citation25], purple represents Ref. [Citation24], and gray represents Ref. [Citation32]. The black broken curve is based on extrapolation from Ref. [Citation33].
![Figure 4. Thermal conductivity of MgO at 300 K as a function of pressure. Experimental data are shown as symbols. Red circles represent our results, open circles represent MgO single crystal [Citation22], open squares represent polycrystalline MgO [Citation27], and open triangles represent polycrystalline MgO [Citation31]. Our suggested density dependence based on Equation (5) and the theoretical data reported in literature are shown using solid curves: red represents this study, cyan represents Ref. [Citation23], green represents Ref. [Citation34], yellow represents Ref. [Citation25], purple represents Ref. [Citation24], and gray represents Ref. [Citation32]. The black broken curve is based on extrapolation from Ref. [Citation33].](/cms/asset/ac8cc26f-354e-47c2-a242-e1df1a87f24c/ghpr_a_2193892_f0004_oc.jpg)
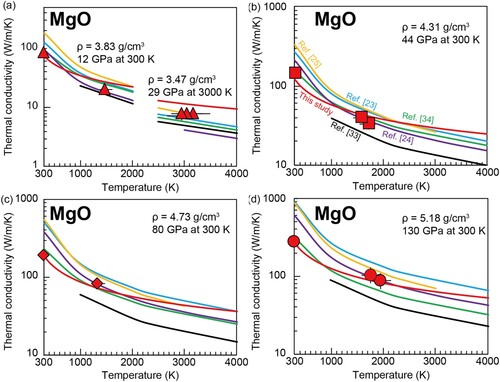
Figure 5. Temperature dependence of the thermal conductivity of MgO with density of (a) 3.83 and 3.47 g/cm3, (b) 4.31 g/cm3, (c) 4.73 g/cm3, and (d) 5.18 g/cm3. Red circles represent our results. Theoretical data and our suggested density dependence based on Equation (5) are shown in curves in each panel. The symbols and curve colors correspond to those in .
Data availability
The data that support the findings of this study are available from the corresponding author upon reasonable request.