
Figures & data
Figure 1. (a) The X-ray diffraction patterns and Rietveld refinement of poly-crystalline . (b) The temperature dependence of resistivity of poly-crystalline
. The inset shows the plot of ln(ρ) versus the reverse of temperature. (c,d) The sketch of the hexagonal crystal structure in a top and side views, respectively. (e) Energy-dispersive X-ray spectrum for a
single crystal.
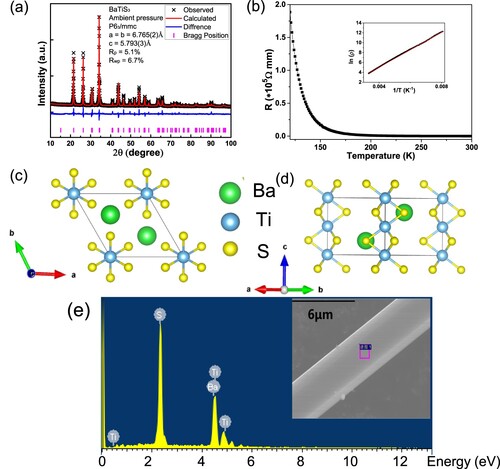
Table 1. Crystallographic data for hexagonal and orthorhombic phase of .
Figure 2. (a) The XRD patterns measured under different pressures. (b) The pressure dependence of crystal lattice constants. (c) The α (the angle of Ti-Ti-Ti in a chain) versus pressure plots. (d) The pressure versus cell volume plots and the fitting using Birch–Murnaghan equation. (e)(f) The refinement results of the XRD patterns measured under 29.9 GPa using the hexagonal and orthorhombic crystal structure, respectively.(g)(h) The sketch of the orthorhombic crystal structure of
in a top and side views, respectively.
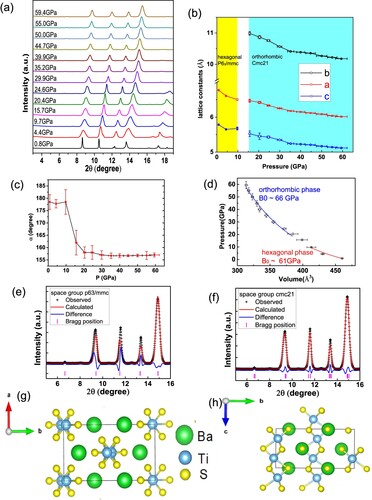
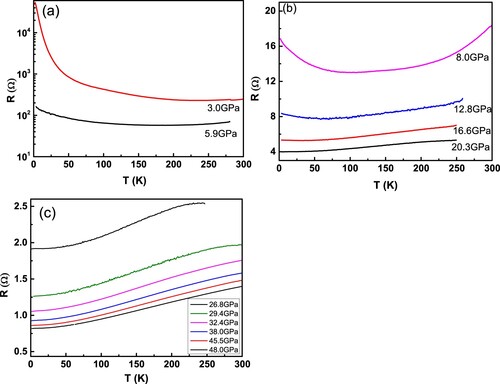
Figure 3. (a–c) Temperature dependence of the resistance measured under different pressures.
Supplemental Material
Download Zip (594.8 KB)Data availability statement
The data that support the findings of this study are available from the corresponding author upon reasonable request.