Figures & data
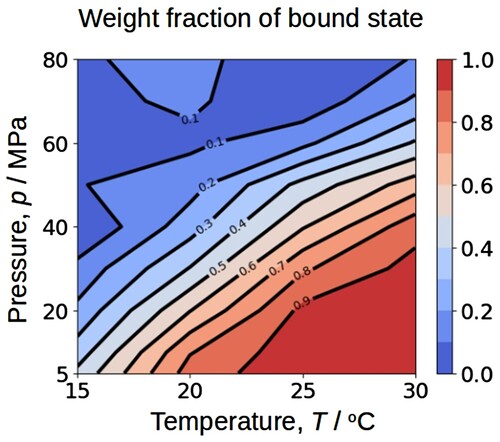
Figure 1. CD spectra of J1-NTase at various temperatures under atmospheric pressure in the far (a) and near (b) ultraviolet regions. In common with (a) and (b), the spectra are plotted in colors ranging from violet (5°C) to red (30°C). The far-ultraviolet spectrum (a) decreases slightly with temperature, while the near-ultraviolet one (b) decreases significantly with temperature, with positive peaks becoming negative peaks.
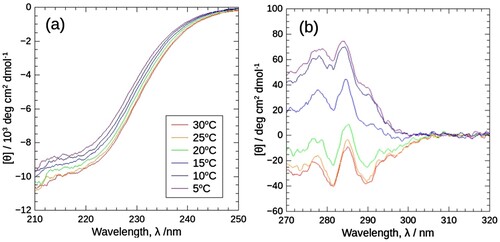
Figure 2. (Left) Negative stain electron microscopy map of the J1-NTase helical assembly (EMD-1313) and the homology model based on it [Citation31]. (Right) Magnified view of one of the contiguous dimers. The top left (blue) and bottom left (green) monomers combine at the A-interface to form a protomer, as do the top right (orange) and bottom right (red) monomers. Unstructured and intertwined C-terminal chains are supposed to situate on the backside of the figure. The two protomers combine at the C-interface. Trp residues which primarily contribute to the near-ultraviolet CD spectrum are represented by space-filling model. Because one of the four Trp residues in each monomer, Trp59, is located at the C-interface, protomer-protomer binding may alter the spatial arrangement and relative orientation of the Trp residues without major conformational changes within the protomer, resulting in changes in the near-ultraviolet CD spectrum.
![Figure 2. (Left) Negative stain electron microscopy map of the J1-NTase helical assembly (EMD-1313) and the homology model based on it [Citation31]. (Right) Magnified view of one of the contiguous dimers. The top left (blue) and bottom left (green) monomers combine at the A-interface to form a protomer, as do the top right (orange) and bottom right (red) monomers. Unstructured and intertwined C-terminal chains are supposed to situate on the backside of the figure. The two protomers combine at the C-interface. Trp residues which primarily contribute to the near-ultraviolet CD spectrum are represented by space-filling model. Because one of the four Trp residues in each monomer, Trp59, is located at the C-interface, protomer-protomer binding may alter the spatial arrangement and relative orientation of the Trp residues without major conformational changes within the protomer, resulting in changes in the near-ultraviolet CD spectrum.](/cms/asset/7d03b8cd-6c75-4d81-9ca7-653359ad202f/ghpr_a_2341805_f0002_oc.jpg)
Figure 3. Comparison of near-ultraviolet CD spectra of J1-NTase (top) and the corresponding high-tension (HT) voltages of the photomultiplier (PM) (bottom) obtained using a high-pressure optical cell and those using a normal quartz cell. The spectra using a high-pressure optical cell were obtained with sample concentrations of 4, 2, and 1 mg/mL, at 5 MPa, 25°C (red, green, and blue solid lines). The spectra using a normal quartz cell were with 4 mg/mL, at atmospheric pressure, 25°C (dotted lines). CD spectrum (top) does not show significant changes depending on the sample concentration or cell used. On the other hand, the HT voltage (bottom) varies, and that with the high-pressure cell is higher than that with the normal cell, and the higher the sample concentration. The solvent used for sample preparation was ‘no-association buffer’, i.e. 10 mM potassium phosphate buffer pH 7.5 containing 1 mM DTT, in which J1-NTase protomer does not associate. The wavelength range of 270-285 nm is screened because data correction shown in would be failed in this range, as discussed in the text.
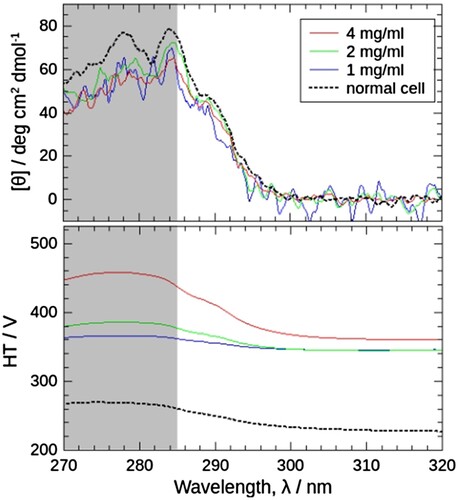
Figure 4. The raw spectra obtained by HP-CD spectroscopy at 5 MPa (red), 40 MPa (green), and 80 MPa (blue), 30°C, and the flow of data correction. (a) and (b) Raw CD spectra of solvent (10 mM potassium phosphate buffer pH 7.5 containing 200 mM KCl and 1 mM DTT) and 4 mg/mL J1-NTase sample. The spectra of the solvent and sample drift and shift with each pressure; 5 MPa, middle; 40 MPa, top; 80 MPa, bottom. Cancelling these modulations by simply subtracting the solvent from the sample becomes more difficult with increasing pressure. (c) As alternative baselines to cancel the drift and shift, regression lines were calculated for the 305–320 nm sample spectra, since the CD spectral intensity of J1-NTase would remain zero in this range. (d) Data correction by subtraction of the regression line resulted in CD spectra that varied with pressure; 5 MPa, the lowest negative, 40 MPa, negative; 80 MPa, positive spectra.
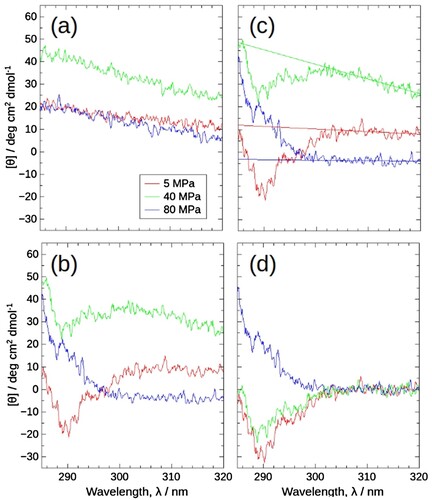
Figure 5. (a) Near-ultraviolet CD spectra of J1-NTase under various pressures at 15, 20, 25, and 30°C. In common with all boxes, the spectra are plotted in colors ranging from red (5 MPa) to violet (80 MPa), indicating that the spectrum increases with pressure. (b) The [θ]290 values read in (a) are plotted against pressure. The different colors of the symbols represent the respective temperatures, and the open symbols at 0.1 MPa corresponds to the value measured using a normal quartz cell at atmospheric pressure. The [θ]290 increases with pressure, shifting to higher pressures at higher temperatures.
![Figure 5. (a) Near-ultraviolet CD spectra of J1-NTase under various pressures at 15, 20, 25, and 30°C. In common with all boxes, the spectra are plotted in colors ranging from red (5 MPa) to violet (80 MPa), indicating that the spectrum increases with pressure. (b) The [θ]290 values read in (a) are plotted against pressure. The different colors of the symbols represent the respective temperatures, and the open symbols at 0.1 MPa corresponds to the value measured using a normal quartz cell at atmospheric pressure. The [θ]290 increases with pressure, shifting to higher pressures at higher temperatures.](/cms/asset/721b4ee3-8ddf-48d9-90e9-910aaf268dcb/ghpr_a_2341805_f0005_oc.jpg)
Figure 6. The reconstituted spectra obtained by MCR-ALS (solid lines) and the corresponding experimental spectra (dashed lines) in (a). The difference values between them are also shown under each spectral box.
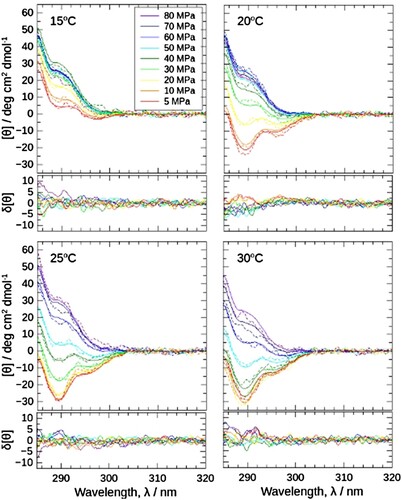
Figure 7. MCR-ALS results for the CD spectral set in (a). (a) Decomposed positive (blue) and negative (red) spectra corresponding to the free (protomer) and bound (oligomer) states, respectively. Starting with the random matrix as C, 100 calculations were performed to obtain the mean spectra. The standard deviation of the results was also calculated and plotted as error ranges, but they were too small to visualize. Inset: Singular values of the Σ matrix obtained by SVD analysis (Supporting Materials), pointing that two components are sufficient to explain the entire CD spectral data set. (b) Weight fractions of the protomers in free and bound states were plotted against pressure as blue squares and red circles, respectively.
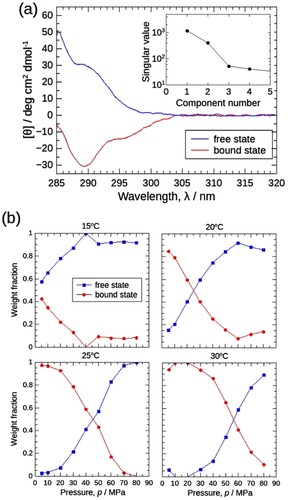
Figure 8. Contour map of the weight fraction of the bound state as a function of temperature and pressure, read from (b). The lower the temperature and the higher the pressure, the lower fraction of the bound state.