Figures & data
Table 1. Nominal deposited dose per session (NDDS) and the corresponding mixture concentrations in the pulmonary fluid for different propylene glycol/vegetable glycerin (PG/VG) ratios in the inhaled aerosolized e-liquid.
Figure 1. Definition of the mean surface tension (mean ST) and the surface tension amplitude (ST amplitude) in the experimental γ-A relationship (hysteresis loop).
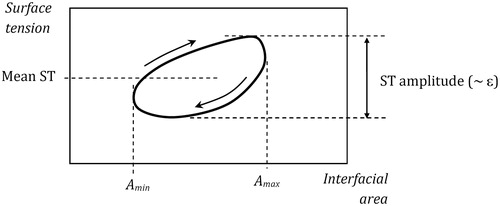
Figure 2. Mean surface tension of lung surfactant (LS) in the presence of e-liquid mixture of various compositions and concentrations (NDDS – estimated nominal deposition dose per session). Data for the normal rate of breathing (0.25 Hz). Dashed lines show the control range (pure LS).
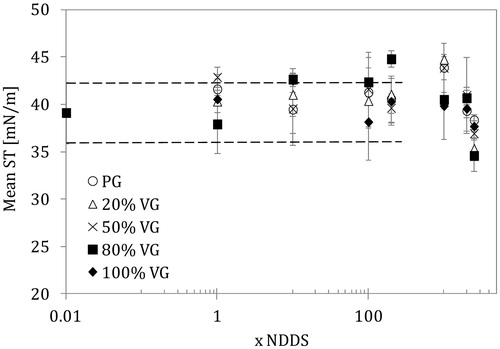
Figure 3. Amplitude of surface tension variations (amplitude ST) in the lung surfactant (LS) in the presence of e-liquid mixture of various compositions and concentrations (NDDS – estimated nominal deposition dose per session). Data for the normal rate of breathing (0.25 Hz). Dashed lines show the control range (pure LS).
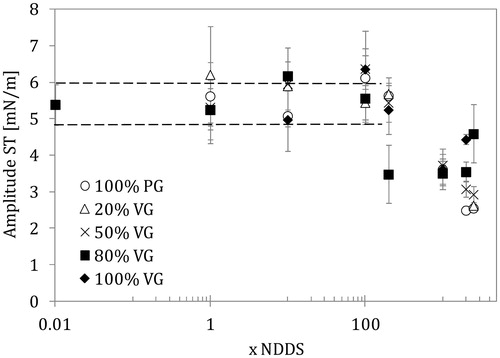
Figure 4. Surface dilatational elasticity of the lung surfactant (LS) liquid interface in the presence of e-liquid mixtures of various compositions and concentrations (NDDS – estimated nominal deposition dose per session). Data for the normal rate of breathing (0.25 Hz). Dashed lines show the control range (pure LS).
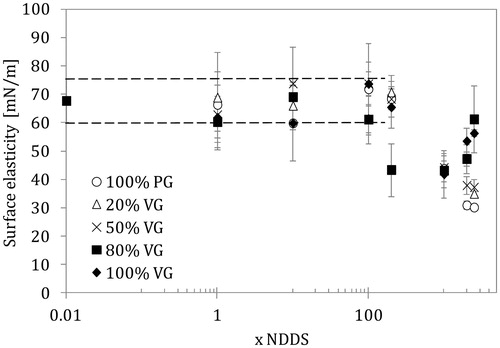
Figure 5. Surface dilatational viscosity of the lung surfactant (LS) liquid interface in the presence of e-liquid mixtures of various compositions and concentrations (NDDS – estimated nominal deposition dose per session). Data for the normal rate of breathing (0.25 Hz). Dashed lines show the parameter range as in .
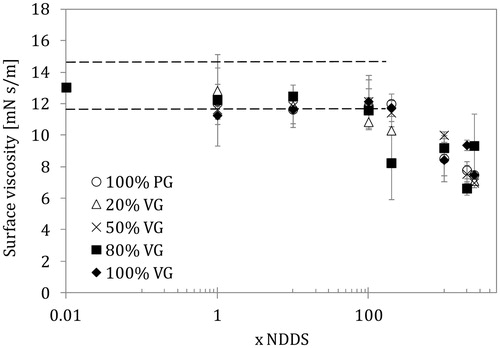
Figure 6. Total deviation (TDP) based on the combined deviations of three numerical parameters according to Equation (3) for e-liquids with different compositions and concentrations in the lung surfactant (LS) solution (NDDS – estimated nominal deposition dose per session). Data for the normal rate of breathing (0.25 Hz).
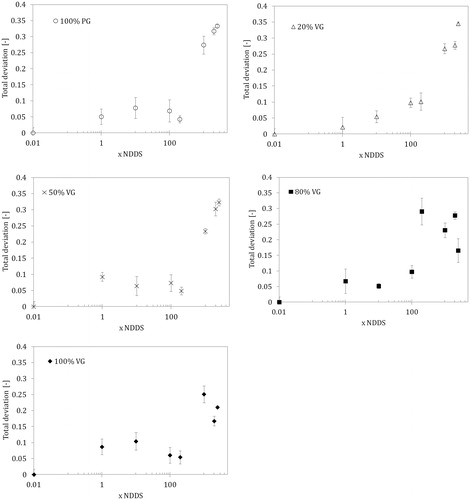
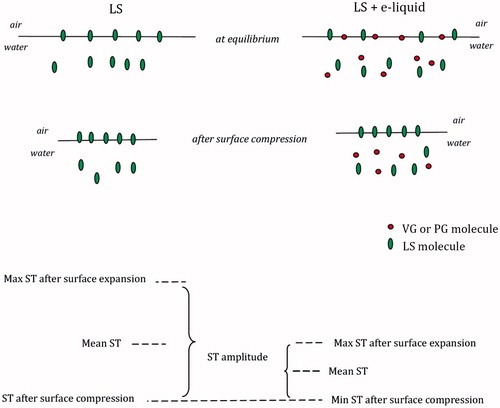
Figure 7. Schematic illustration of the local boost of humectants concentration in the pulmonary liquid after deposition and spreading of a single inhaled e-liquid droplet.
Figure 8. Proposed mechanism for lung surfactant (LS) – aerosol former (e-liquid) interactions.