Figures & data
Table 1. Physicochemical characteristics of the HTIW, including surface area, solubility, crystalline silica content, and number-weighted arithmetic mean fiber length and diameter, as well as aspect ratio and % fibers with a diameter less than 3 µm. d.µm refers to the hydrodynamic diameter, and PdI to the polydispersity index.
Figure 1. Scanning electron microscopy images of the fibers and particles investigated, including CMS-f (unheated fibers), CMS-f/h (heated fibers), MS-f (unheated fibers), MS-f/h (heated fibers), CaS-f (unheated fibers), CaS-f/h (heated fibers), RCF-f (unheated fibers), RCF-f/h (heated fibers). The scale of each image is included at the bottom right of each image, and represents 50 μm on the HTIW images, and 5 μm on the images of DQ12 and TiO2.
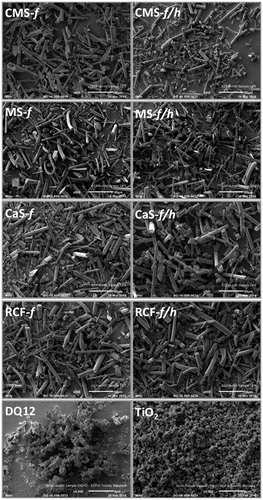
Figure 2. SEM images of untreated/control J774A.1 cells, and cell treated with CMS-f (unheated fibers), CMS-f/h (heated fibers), MS-f (unheated fibers), MS-f/h (heated fibers), CaS-f (unheated fibers), CaS-f/h (heated fibers), RCF-f (unheated fibers), RCF-f/h (heated fibers). Cells were exposed to 40 μg/cm2 for 24 h prior to SEM preparation, and imaged using a FEI Quanta 3D FEG scanning electron microscope. A scale bar is shown at the bottom right corner of each image.
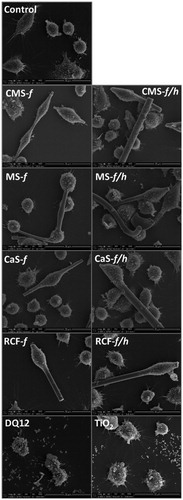
Figure 3. Cell viability, determined by mitochondrial activity (AlamarBlue assay), in response to HTIW. A-C) A549 cells and D-F) J774A.1 cells were treated for 24 h with 0-80 μg/cm2 heated and unheated CMS-f, MS-f, CaS-f and RCF-f, as well as particle controls DQ12 and TiO2. Results are expressed as % viability compared to vehicle (medium-only) control, and each data point represents the mean ± SD of at least three independent biological replicates. Statistical significance of particle exposures in comparison to medium only is indicated with * when p < 0.05.
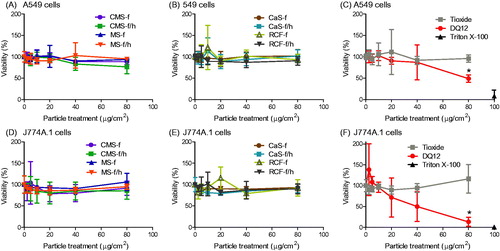
Figure 4. GRO-α release from A549 cells treated for 24 h with 0-40 μg/cm2 heated and unheated CMS-f, MS-f, CaS-f and RCF-f, as well as particle controls DQ12 and TiO2. Each data point represents the mean ± SD of at least three independent biological replicates. Statistical significance of particle exposures in comparison to medium only is indicated when p < 0.05, identifying markers are shown on corresponding legends, and with ∞ when a heated sample is significantly different to an unheated sample.
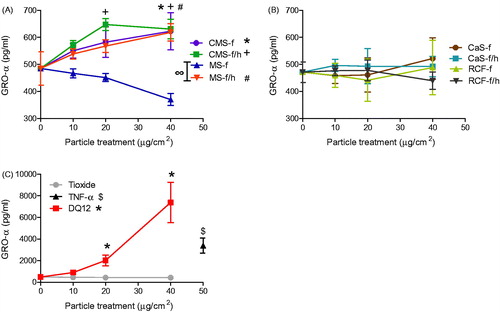
Figure 5. TNF-α release from J774A.1 cells treated for 24 h with 0-40 μg/cm2 heated and unheated CMS-f, MS-f, CaS-f and RCF-f, as well as particle controls DQ12 and TiO2. Each data point represents the mean ± SD of at least three independent biological replicates. Statistical significance of particle exposures in comparison to medium only is indicated when p < 0.05, identifying markers are shown on corresponding legends.
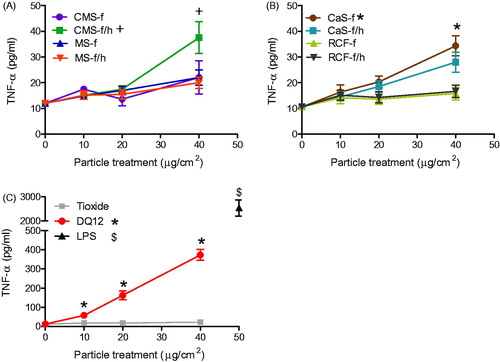
Figure 6. RANTES release from J774A.1 cells treated for 24 h with 0-40 μg/cm2 heated and unheated CMS-f, MS-f, CaS-f and RCF-f, as well as particle controls DQ12 and TiO2. Each data point represents the mean ± SD of at least three independent biological replicates. Statistical significance of particle exposures in comparison to medium only is indicated when p < 0.05, identifying markers are shown on corresponding legends, and with ∞ when a heated sample is significantly different to an unheated sample.
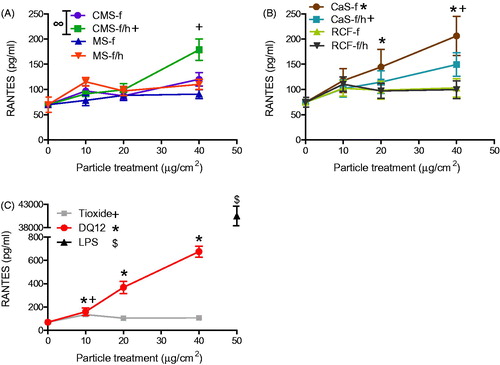
Figure 7. MIP-2 release from J774A.1 cells treated for 24 h with 0-40 μg/cm2 heated and unheated CMS-f, MS-f, CaS-f and RCF-f, as well as particle controls DQ12 and TiO2. Each data point represents the mean ± SD of at least three independent biological replicates. Statistical significance of particle exposures in comparison to medium only is indicated when p < 0.05, identifying markers are shown on corresponding legends, and with ∞ when a heated sample is significantly different to an unheated sample.
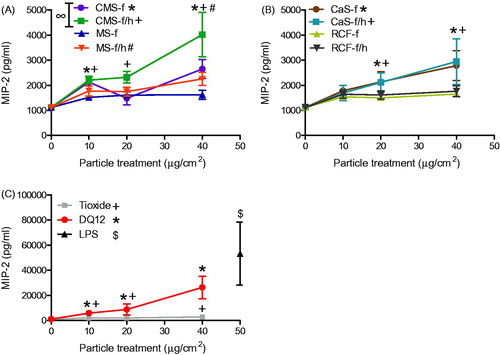
Figure 8. Effect of aluminum lactate coating on the release of pro-inflammatory mediators, including GRO-α from A549 cells (A), and TNF-α (B) and MIP-2 (C) from J774A.1 cells. Cells were treated for 24 h with 0-40 μg/cm2 heated, crystalline silica-containing CMS-f/h. The test material was either coated with AL (grey lines) or processed in the same fashion in PBS without AL (black lines). Each data point represents the mean ± SD of at least three independent biological replicates. Statistical significance of PBS processed particles compared to medium only is indicated with * when p < 0.05, and when AL coating is significantly different to without AL with ∞ when p < 0.05.
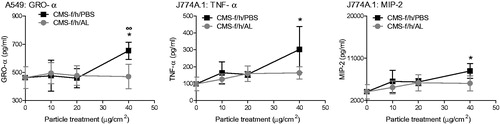
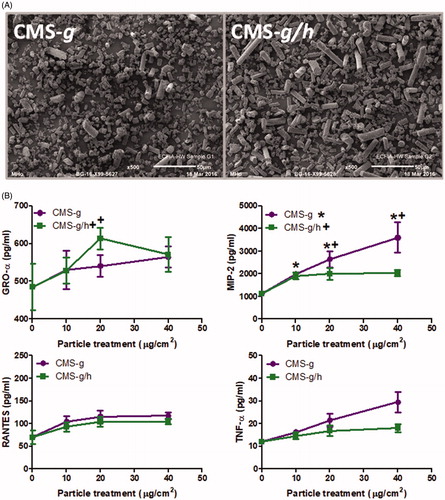
Figure 9. (A) Scanning electron microscopy images of calcium magnesium silicate wools investigated after the fibers had been ground to create a less fibrous morphology, including CMS-g (unheated) and CMS-g/h (heated). The scale of each image is included at the bottom right of each image, and represents 50 μm. B) GRO-α release from A549 cells and MIP-2, RANTES and TNF-α release from J774A.1 cells, all treatments were for 24 h with 0-40 μg/cm2 heated and unheated CMS-g. Each data point represents the mean ± SD of at least three independent biological replicates. Statistical significance of particle exposures in comparison to medium only is indicated when p < 0.05, with * for CMS-g and + for CMS-g/h.