
Figures & data
Table 1. Test materials and exposure concentrations.
Table 2. Exposure characterization.
TABLE 3. Biomarkers of exposure and respiratory function.
Figure 1. Bronchoalveolar lavage fluid (BALF) cytology. (A) Immunophenotyping count of (CD45+) leucocytes in BALF. (B) Immunophenotyping count of (CD3+) T-cells in BALF. The absolute numbers of CD45+ leucocytes or CD3+ T-cells in the BALF increased significantly in the 3R4F group compared to the Sham Control, but remained unchanged in the e-vapor groups. There were no significant differences between e-vapor groups. *Statistically different compared to the Sham Control (p<.05).
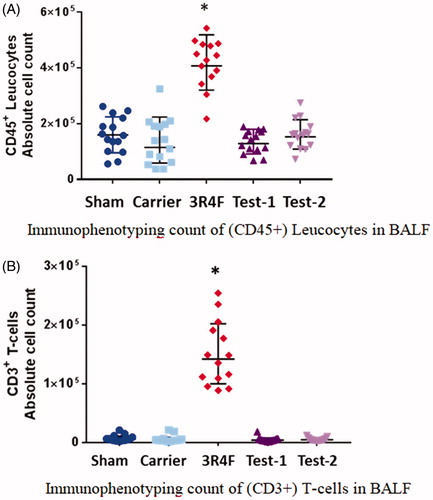
Figure 2. Volcano plots representing the differentially expressed genes in the lung. For each gene, the alteration in gene expression, calculated as the log2 fold-change, and plotted on the x-axis. The statistical significance (false discovery rate [fdr] < 0.05), proportional to the negative log10-adjusted p value, is plotted on the y-axis. Dots highlight genes that are statistically significantly up- and down-regulated (right and left quadrants, respectively) compared with sham.
![Figure 2. Volcano plots representing the differentially expressed genes in the lung. For each gene, the alteration in gene expression, calculated as the log2 fold-change, and plotted on the x-axis. The statistical significance (false discovery rate [fdr] < 0.05), proportional to the negative log10-adjusted p value, is plotted on the y-axis. Dots highlight genes that are statistically significantly up- and down-regulated (right and left quadrants, respectively) compared with sham.](/cms/asset/092ef7ab-7543-46ba-a1fa-5803726f10ae/iiht_a_1576807_f0002_c.jpg)
Figure 3. Biological impact factor (BIF) and network perturbation amplitude (NPA). (A) BIF scores: the percentages give the relative biological impact, which is derived from the cumulated network perturbations caused by the treatment relative to the reference (the treatment showing the highest perturbation; here 3R4F as REF). Only the significant network perturbations are summarized further into this single number; hence, any component entering the score is significant by definition. For each treatment comparison, the δ value (−1 to 1) indicates how similar the underlying network perturbations are with respect to the reference. A value of 1 indicates that all the networks are perturbed by the same mechanisms. (B) Heatmap NPA scores: summary of subnetworks. A network is considered perturbed if, in addition to the significance of the NPA score with respect to the experimental variation, the two companion statistics (O and K), derived to inform on the specificity of the NPA score with respect to the biology described in the network, are significant. *O and K statistic p values below .05 and NPA significant with respect to the experimental variation.
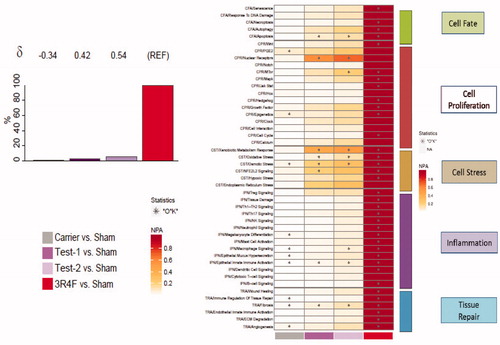
Figure 4. Proteome set enrichment in the lung. Set enrichment was assessed by gene-set analysis (GSA). The fold-change compared with Sham Control is used as the protein-level statistic, the mean as the set statistic, and protein (Q1) and sample (Q2) permutation to assess statistical significance. Enrichment results are normalized per pathway, and the normalized GSA enrichment score is mapped to the color scale. Significance is indicated for the Q1 and Q2 tests in the figure, based on false discovery rate (fdr)-adjusted p values.
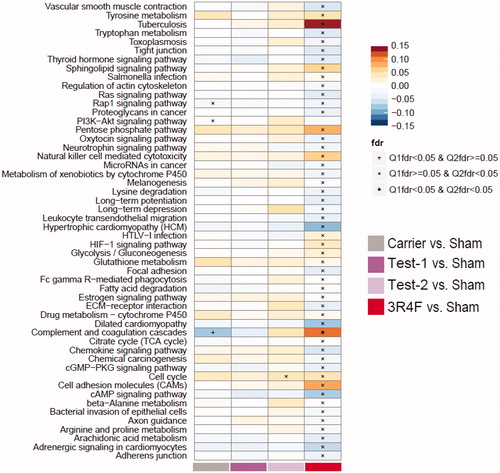
Table 4. Organ weights.
Table 5. Histopathology.