Figures & data
Table 1. Sources used to collect PM2.5 and PM2.5 suspension sample code.
Table 2. Exposure metrics: mass, size and number concentrations.
Figure 1. Inflammatory parameters in bronchoalveolar lavage fluid 24 h post-exposure to re-aerosolized PM2.5 of different sources at very low (VL) (only for brake wear 3 PM), low (L), medium (M) or high dose (H) (not present for brake wear 3 PM) compared to controls. Data are expressed as mean ± SD (n = 4–5 per group).
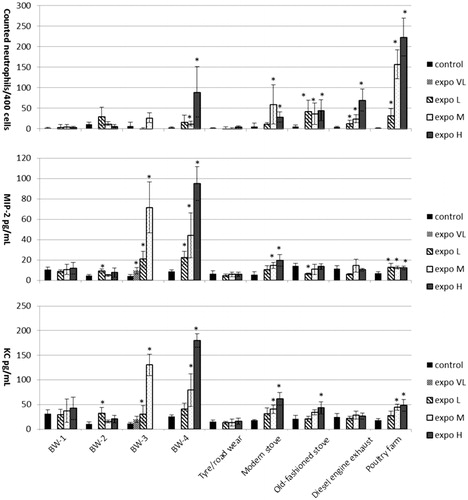
Figure 2. Ranking of PM dose range (BMDL and BMDU) for inflammatory responses in the lung resulting in 20% extra fraction (PMN) or 20% change in response (total cells, MIP-2, KC) compared to controls. Dashed line BMDU infinitive; a dose–response is present, however, at the current doses the in- or decrease in dose–response is too small (<BMR) to derive a BMDU.
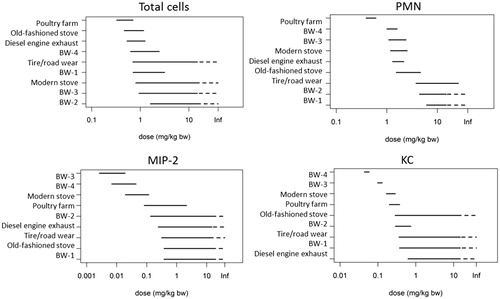
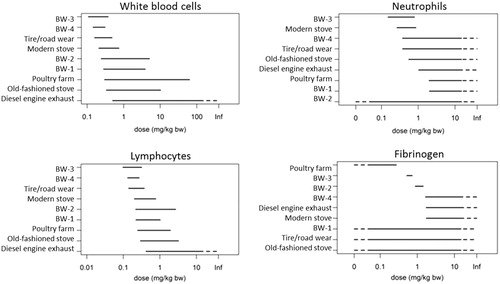
Figure 3. Ranking of PM dose range (BMDL and BMDU) for hematological parameters lung resulting in 10% change in response compared to controls. Dashed line BMDL to zero, the maximum response is already reached at the first dose, i.e. the BMDL lies somewhere between minus infinitive (i.e. zero) and the first dose. Dashed line BMDU infinitive, a dose–response is present, however, at the current doses the in- or decrease in dose–response is too small (<BMR) to derive a BMDU. Dashed line BMD confidence interval ranging from zero to infinitive; data were too scattered to enable dose response analysis.