
Figures & data
Figure 1. (A–D) Acute effects in rats, 24 h post-exposure, of anhydrous ammonia (NH3) exposure via nose-only inhalation (9000–13 000 ppm during 10–20 min); (A) recordings of body weight loss (weight before and after exposure using registered weight); (B) the level of fibrinogen in serum; (C) total cell counts (cells/ml) in bronchoalveolar lavage fluid (BALF); (D) the number of neutrophils (cells/ml) in BALF. The figure bars show increasing concentrations (ppm) of NH3 regardless of exposure time and the values indicate means ± SEM, n = 5–9 rats per group. Statistical significances of NH3-exposed compared to age-matched control rats are indicated (*p < 0.05 and **p < 0.01).
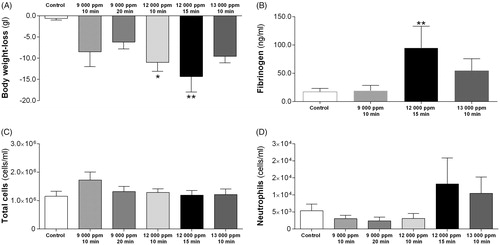
Figure 2. (A–C) Effects in rats subjected to ammonia (1% NH3) via intratracheal instillation on (A) body weight at 5 h–28 days after exposure, (B) spleen weight (g) and (C) heart weight (g) at 5 h and 24 h after exposure. Values indicate means ± SEM, n = 6–8 rats per group. Statistical significances of NH3-exposed animal compared to age-matched control rats (*p < 0.05 and **p < 0.01), and control groups at 14 and 28 days compared to control rats at 5 h–24 h are indicated (![]() p < 0.001).
p < 0.001).
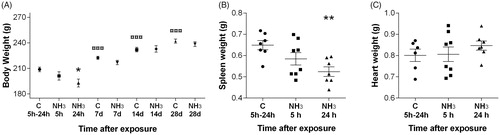
Figure 3. Total cell counts in bronchoalveolar lavage fluid (BALF) in rats at 5 h and 24 h after intratracheal instillation of ammonia (1% NH3). Values indicate means ± SEM, n = 5–8 rats per group. Statistical significances of NH3-exposed compared to age-matched control rats are indicated (*p < 0.05 and ***p < 0.001).
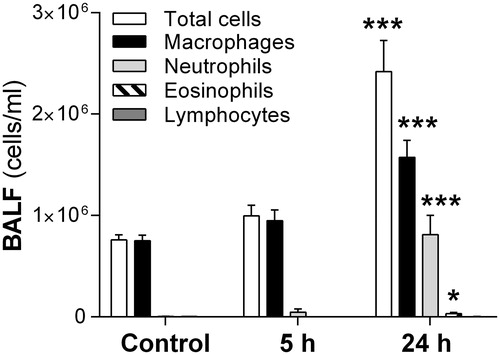
Table 1. In female rats exposed to i.t. instillation of ammonia (1% NH3) (A) the number of thrombocytes (×109/L) in blood was measured at 24 h, (B) inflammatory mediators in bronchoalveolar lavage fluid (BALF) and serum were measured at 5 h and 24 h after exposure and (C) the amount of collagen was quantified at 14 and 28 days after exposure.
Figure 4. (A–F) Respiratory mechanics in rats at 24 h after exposure intratracheal instillation of ammonia (1% NH3). Measurements of methacholine (MCh)-induced (A) RRS: respiratory resistance, (B) RN: Newtonian resistance, (C) G: tissue resistance, (D) ERS: respiratory elastance, (E) H: tissue elastance, and (F) η: hysteresivity were performed using the Flexivent™. Values indicate means ± SEM, n = 6 rats per group. Statistical significances of NH3-exposed compared to age-matched control rats are indicated (**p < 0.01 and ***p < 0.001).
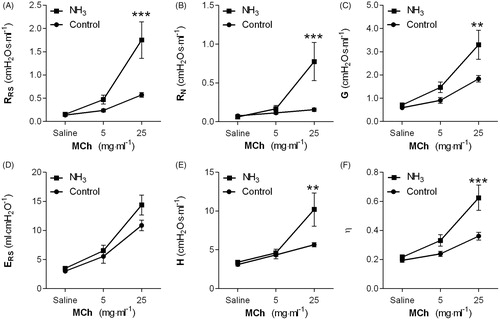
Figure 5. (A–F) Lung tissue sections stained with Masson’s Trichrome in order to visualize fibrin (red stain) and collagen deposition (blue stain) in small-bronchial regions (top panel C and E) and alveolar regions (lower panel, D and F) of rats subjected to ammonia (1% NH3) via intratracheal instillation evaluated in comparison to (A,B) healthy controls. Representative sections are shown from (C,D) 5 h and (E,F) 24 h post-exposure. Photos were taken at 100× magnification using light microscopy. The figure shows representative tissue sections from each group of 4 animals.
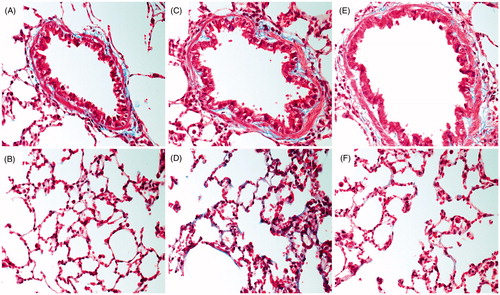
Figure 6. (A–H) Histopathological changes in alveolar (top panel C, E, and G) and bronchial regions (lower panel, D, F, and H) of rats subjected to ammonia (1% NH3) via intratracheal instillation evaluated in comparison to (A,B) healthy controls. Representative sections are shown from (C,D) 5 h, (E,F) 24 h, and (G,H) 14 days and 28 days post-exposure. Sections were stained with hematoxylin-eosin and evaluated with light microscopy using 40× magnification (n = 4 rats per group).
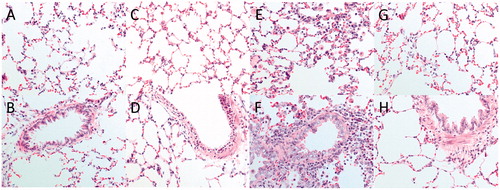
Table 2. Histopathology, scoring the main features of lung lesions at different time-points after ammonia (1% NH3) i.t. instillation exposure.