
Figures & data
Table 1. Blood and lung tissue sampling schedule in the rats exposed in vivo to the formulation containing 2.5% or 5% nicotine. All time points denote time after start of aerosol exposure (t = 0).
Figure 1. The upper panels show SEM images (two on the left) and a light microscope photo (right) of the 2.5% nicotine formulation. The lower panels show SEM images and a light microscope photo of the 5% nicotine formulation.
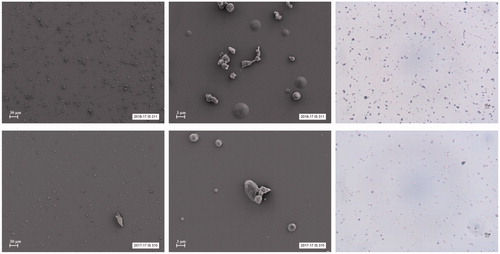
Figure 2. PK profiles of 2.5% and 5% nicotine powders tested in DissolvIt (mean ± SD). (A) Nicotine concentration in the perfusate over time. (B) Nicotine concentration normalized to the deposited dose. min: minutes.
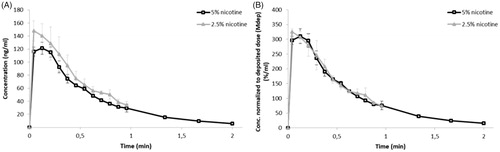
Figure 3. The undissolved and/or unabsorbed fraction of the deposited nicotine dose (mean ± SD) remaining in the DissolvIt system as a function of time. min: minutes.
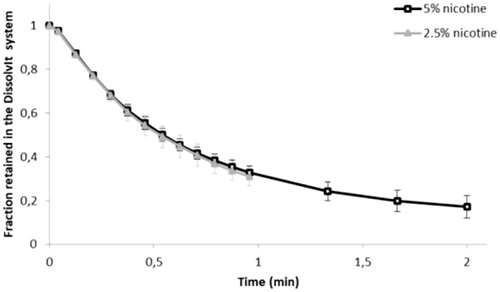
Table 2. PK parameters (mean ± SD) of the derived DissolvIt data for 2.5% and 5% nicotine powder aerosols.
Table 3. Key parameters (mean ± standard deviation) of the inhalation exposures in the isolated perfused lung model ex vivo and in the intratracheally intubated rat in vivo.
Figure 4. Nicotine concentration (mean ± standard deviation, n = 3) as a function of time in the single-pass lung perfusate of the IPL exposed ex vivo to powder aerosols containing 5% or 2.5% nicotine. min: minutes.
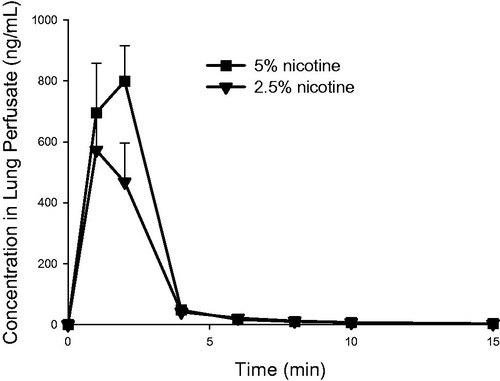
Table 4. PK parameters of nicotine (mean, n = 3), in the rat IPL exposed ex vivo to powder aerosols containing 5% or 2.5% nicotine.
Figure 5. Nicotine concentration (normalized to the initially deposited dose according to LC-MS/MS) as a function of time in the single-pass lung perfusate of the rat IPL exposed ex vivo to powder aerosols containing 5% or 2.5% nicotine. %MDEP/mL, percentage of the initially deposited dose (MDEP) cleared per milliliter of lung perfusate. Data are presented as mean ± standard deviation (n = 3). min: minutes.
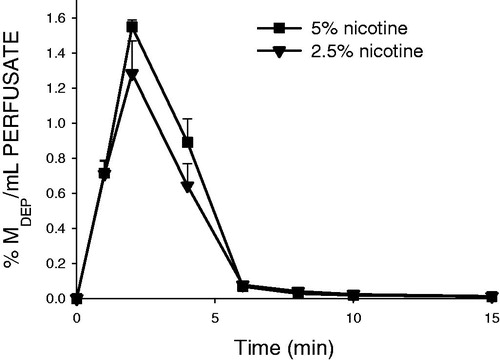
Figure 6. Nicotine retention (normalized to the initially deposited dose according to LC-MS/MS) in the lung as a function of time in the rat IPL exposed ex vivo to powder aerosols containing 5% or 2.5% nicotine. Fraction MDEP, fraction of the initially deposited dose (MDEP) retained in the lung. Data are presented as mean ± standard deviation (n = 3). min: minutes.
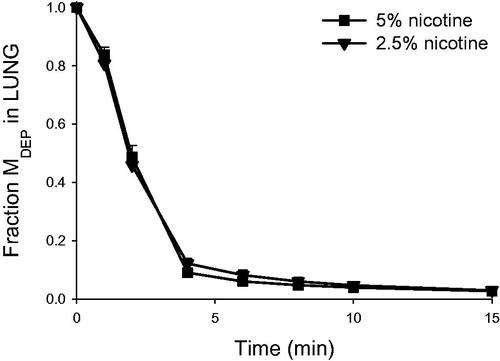
Figure 7. Blood plasma concentrations of nicotine and cotinine (mean ± standard deviation, n = 3) as a function of time in rats intratracheally exposed to powder aerosols containing 5% or 2.5% nicotine. h: hours.
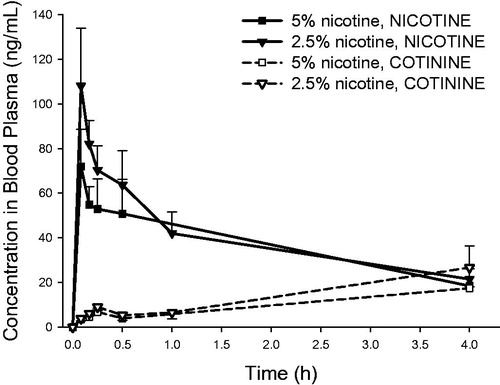
Figure 8. Lung concentrations of nicotine and cotinine (mean ± standard deviation, n = 3) as a function of time in rats intratracheally exposed to powder aerosols containing 5% or 2.5% nicotine. h: hours.
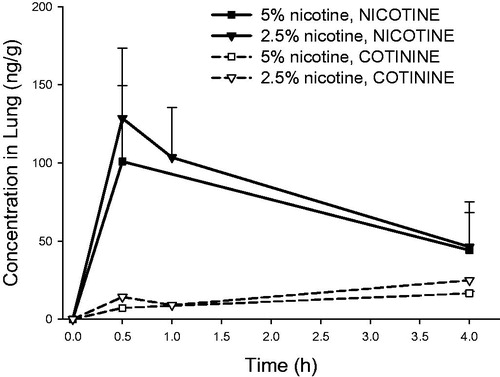
Table 5. Plasma PK parameters for nicotine and cotinine (mean, n = 3) in rats intratracheally exposed to powder aerosols containing 5% or 2.5% nicotine.
Table 6. Lung PK parameters for nicotine and cotinine (mean, n = 3) in rats intratracheally exposed to powder aerosols containing 5% or 2.5% nicotine.