
Figures & data
Figure 1. Chloroprene PBPK model diagram. QP: alveolar ventilation; CI: inhaled concentration; CX: exhaled concentration; QC: cardiac output; CA: arterial blood concentration; CV: venous blood concentration; QS, CVS: blood flow to, and venous concentration leaving, the slowly perfused tissues (e.g., muscle); QR, CVR: blood flow to, and venous concentration leaving, the richly perfused tissues (most organs); QF, CVF: blood flow to, and venous concentration leaving, the fat; QL, CVL: blood flow to, and venous concentration leaving, the liver; QK, CVK: blood flow to, and venous concentration leaving, the kidney.
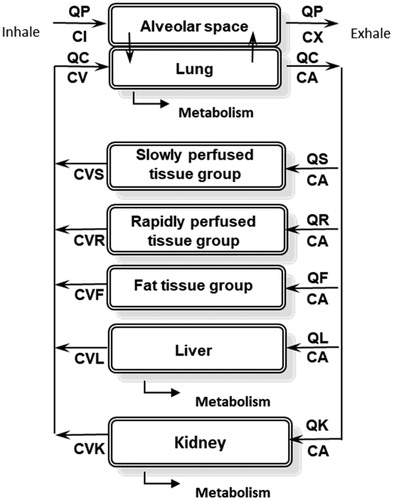
Figure 2. Measured minute ventilation during exposures.
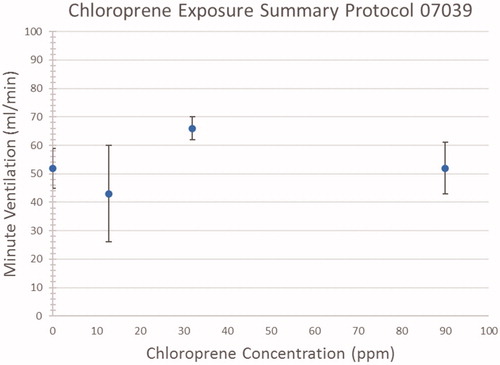
Figure 3. Blood chloroprene concentrations during and following a single nose-only exposure of female B6C3F1 mice to chloroprene at 13, 32 and 90 ppm for 6 hr. Average blood chloroprene concentrations (symbols) and standard deviations (error bars) are shown for each treatment group.
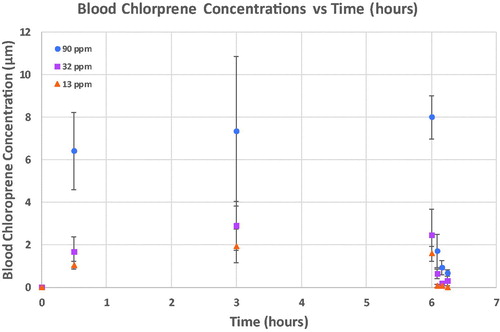
Figure 4. PBPK model predicted (dotted lines) and measured (symbols) blood concentrations during and following 6-hr exposures of B6C3F1 mice to chloroprene at 12.3 (green), 32 (fuchsia) or 90 (blue) ppm. The same data and model predictions are shown using a linear y axis (left) and a logarithmic y axis (right). The linear plot provides a better comparison for concentrations, whereas the logarithmic plot provides a clearer comparison for the post-exposure clearance.
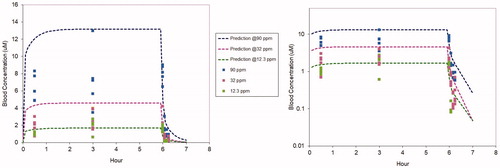
Figure 5. Parameter sensitivity coefficients for the chloroprene PBPK model for the prediction of blood concentrations in the nose-only study.
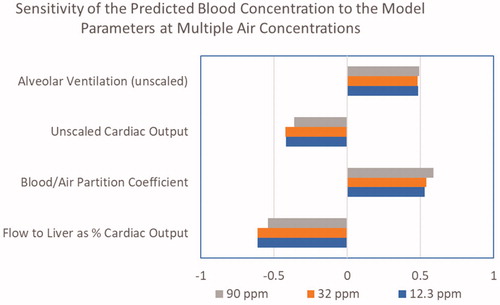
Figure 6. Parameter sensitivity coefficients for the chloroprene PBPK model for the prediction of lung dose metrics in the female mouse for exposures in the 2-year bioassay.
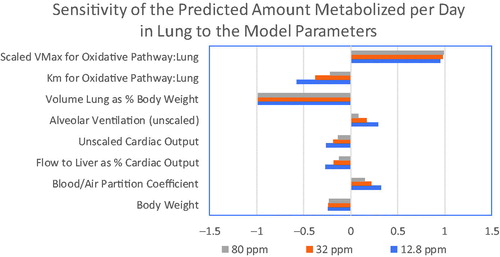
Figure 7. Parameter sensitivity coefficients for the chloroprene PBPK model for the prediction of lung dose metrics in the human for continuous exposures.
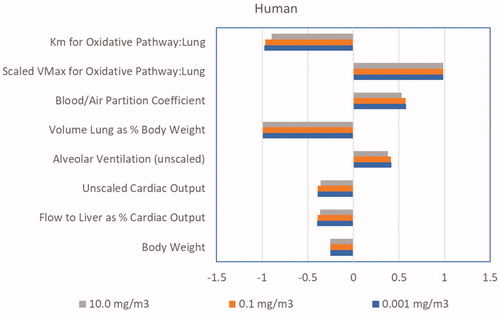
Table 1. Dose metrics for lung metabolism (average mg metabolized per gram lung per day) in the female mouse bioassay and for human continuous exposures.
Table 2. Percentiles of daily lung metabolism dose metric distributions in the mouse bioassay and for a human continuous exposure to 1 µg/m3 chloroprene, as well as the resulting BMDLs and IURs, using the newly estimated parameters in this study based on the in vitro assays with chloroprene (including the estimated first order rate of metabolism of chloroprene in the human lung).
Figure 8. Inhaled concentration dependence of lung metabolism in the human for continuous exposures to chloroprene predicted with the PBPK model.
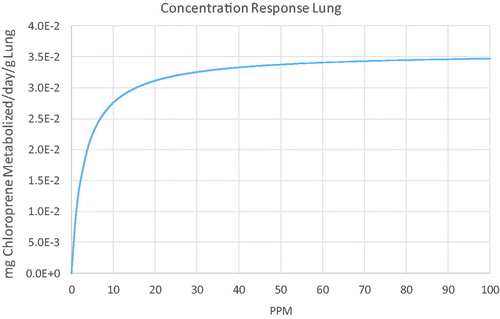
Figure 9. Comparison of dose-response for lung tumors in chloroprene bioassays in rodents.
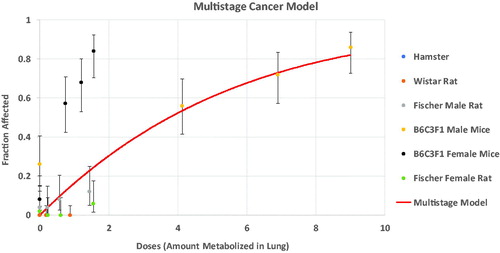
Table 3. Comparison of predictions of current model parameterization with previously published model (Yang et al. Citation2012).